Immigrants from Congo vs Alsatian Unemployment Among Ages 25 to 29 years
COMPARE
Immigrants from Congo
Alsatian
Unemployment Among Ages 25 to 29 years
Unemployment Among Ages 25 to 29 years Comparison
Immigrants from Congo
Alsatians
6.4%
UNEMPLOYMENT AMONG AGES 25 TO 29 YEARS
90.4/ 100
METRIC RATING
103rd/ 347
METRIC RANK
6.7%
UNEMPLOYMENT AMONG AGES 25 TO 29 YEARS
28.1/ 100
METRIC RATING
193rd/ 347
METRIC RANK
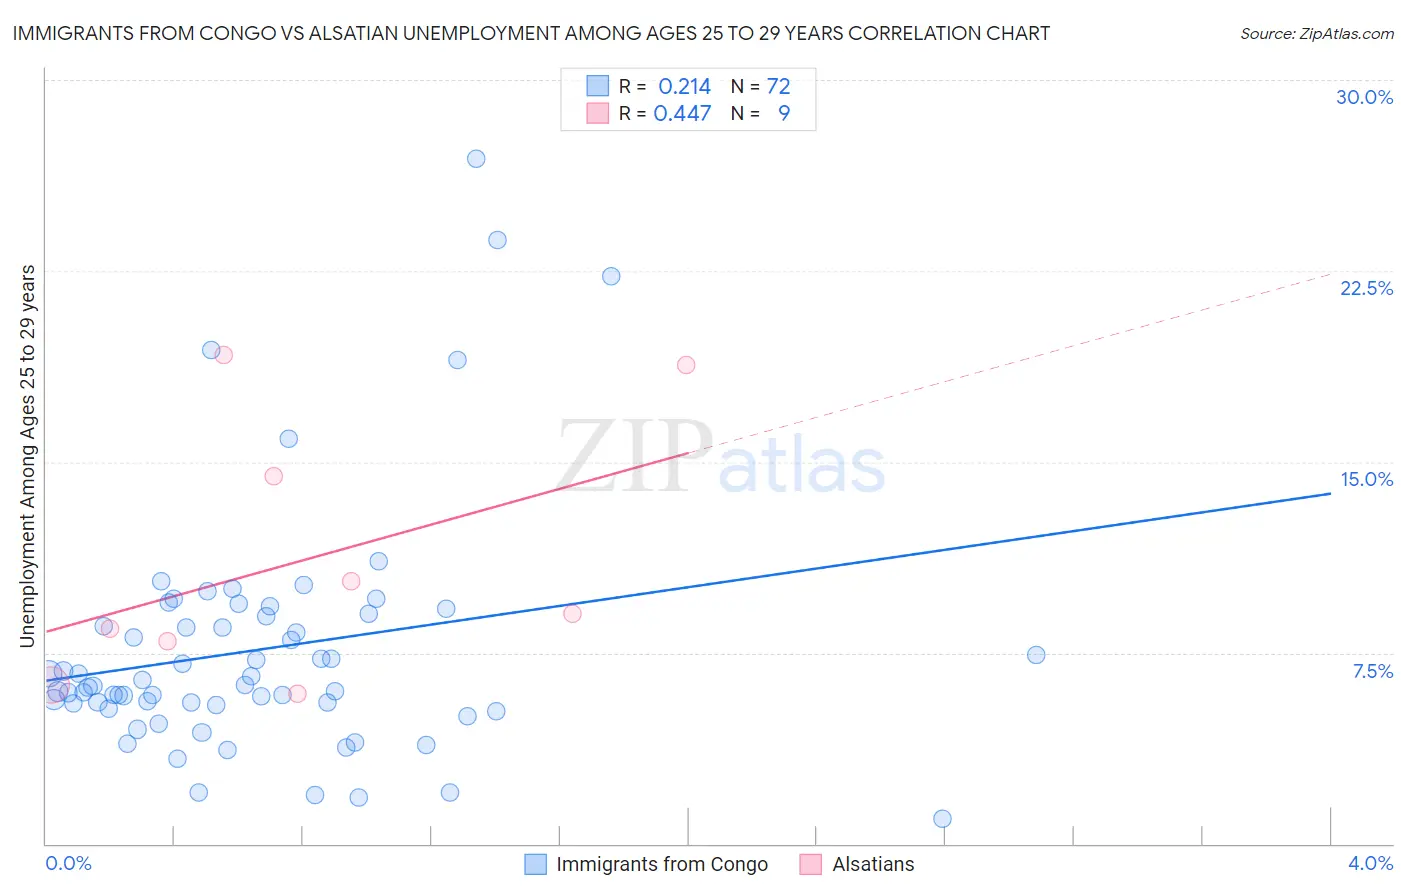
Immigrants from Congo vs Alsatian Unemployment Among Ages 25 to 29 years Correlation Chart
The statistical analysis conducted on geographies consisting of 91,198,685 people shows a weak positive correlation between the proportion of Immigrants from Congo and unemployment rate among population between the ages 25 and 29 in the United States with a correlation coefficient (R) of 0.214 and weighted average of 6.4%. Similarly, the statistical analysis conducted on geographies consisting of 80,994,703 people shows a moderate positive correlation between the proportion of Alsatians and unemployment rate among population between the ages 25 and 29 in the United States with a correlation coefficient (R) of 0.447 and weighted average of 6.7%, a difference of 5.1%.
Unemployment Among Ages 25 to 29 years Correlation Summary
| Measurement | Immigrants from Congo | Alsatian |
| Minimum | 1.0% | 5.9% |
| Maximum | 26.9% | 19.2% |
| Range | 25.9% | 13.3% |
| Mean | 7.6% | 11.1% |
| Median | 6.2% | 9.0% |
| Interquartile 25% (IQ1) | 5.5% | 7.1% |
| Interquartile 75% (IQ3) | 9.0% | 16.6% |
| Interquartile Range (IQR) | 3.5% | 9.5% |
| Standard Deviation (Sample) | 4.8% | 5.1% |
| Standard Deviation (Population) | 4.8% | 4.8% |
Similar Demographics by Unemployment Among Ages 25 to 29 years
Demographics Similar to Immigrants from Congo by Unemployment Among Ages 25 to 29 years
In terms of unemployment among ages 25 to 29 years, the demographic groups most similar to Immigrants from Congo are British (6.4%, a difference of 0.020%), Cypriot (6.4%, a difference of 0.060%), Immigrants from Kazakhstan (6.4%, a difference of 0.10%), Immigrants from Ireland (6.4%, a difference of 0.14%), and Uruguayan (6.4%, a difference of 0.15%).
| Demographics | Rating | Rank | Unemployment Among Ages 25 to 29 years |
| Immigrants | Brazil | 92.1 /100 | #96 | Exceptional 6.4% |
| Immigrants | Eastern Europe | 91.9 /100 | #97 | Exceptional 6.4% |
| Serbians | 91.7 /100 | #98 | Exceptional 6.4% |
| Iraqis | 91.3 /100 | #99 | Exceptional 6.4% |
| Uruguayans | 91.2 /100 | #100 | Exceptional 6.4% |
| Immigrants | Ireland | 91.1 /100 | #101 | Exceptional 6.4% |
| British | 90.5 /100 | #102 | Exceptional 6.4% |
| Immigrants | Congo | 90.4 /100 | #103 | Exceptional 6.4% |
| Cypriots | 90.1 /100 | #104 | Exceptional 6.4% |
| Immigrants | Kazakhstan | 89.8 /100 | #105 | Excellent 6.4% |
| Immigrants | Hungary | 89.4 /100 | #106 | Excellent 6.4% |
| Swiss | 88.6 /100 | #107 | Excellent 6.4% |
| Croatians | 88.2 /100 | #108 | Excellent 6.4% |
| Immigrants | Albania | 87.9 /100 | #109 | Excellent 6.4% |
| Europeans | 87.8 /100 | #110 | Excellent 6.4% |
Demographics Similar to Alsatians by Unemployment Among Ages 25 to 29 years
In terms of unemployment among ages 25 to 29 years, the demographic groups most similar to Alsatians are Immigrants from Greece (6.7%, a difference of 0.0%), Immigrants from Ukraine (6.7%, a difference of 0.040%), Chickasaw (6.7%, a difference of 0.050%), Immigrants from Western Asia (6.7%, a difference of 0.060%), and Korean (6.7%, a difference of 0.090%).
| Demographics | Rating | Rank | Unemployment Among Ages 25 to 29 years |
| Immigrants | Iran | 34.4 /100 | #186 | Fair 6.7% |
| Immigrants | South America | 33.0 /100 | #187 | Fair 6.7% |
| Irish | 32.8 /100 | #188 | Fair 6.7% |
| Argentineans | 32.1 /100 | #189 | Fair 6.7% |
| Koreans | 29.3 /100 | #190 | Fair 6.7% |
| Chickasaw | 28.7 /100 | #191 | Fair 6.7% |
| Immigrants | Ukraine | 28.6 /100 | #192 | Fair 6.7% |
| Alsatians | 28.1 /100 | #193 | Fair 6.7% |
| Immigrants | Greece | 28.0 /100 | #194 | Fair 6.7% |
| Immigrants | Western Asia | 27.3 /100 | #195 | Fair 6.7% |
| Hungarians | 26.8 /100 | #196 | Fair 6.8% |
| Italians | 26.5 /100 | #197 | Fair 6.8% |
| Immigrants | Southern Europe | 24.6 /100 | #198 | Fair 6.8% |
| Guamanians/Chamorros | 24.3 /100 | #199 | Fair 6.8% |
| South American Indians | 23.3 /100 | #200 | Fair 6.8% |