Immigrants from South Eastern Asia vs Alsatian Unemployment Among Ages 25 to 29 years
COMPARE
Immigrants from South Eastern Asia
Alsatian
Unemployment Among Ages 25 to 29 years
Unemployment Among Ages 25 to 29 years Comparison
Immigrants from South Eastern Asia
Alsatians
6.7%
UNEMPLOYMENT AMONG AGES 25 TO 29 YEARS
49.1/ 100
METRIC RATING
175th/ 347
METRIC RANK
6.7%
UNEMPLOYMENT AMONG AGES 25 TO 29 YEARS
28.1/ 100
METRIC RATING
193rd/ 347
METRIC RANK
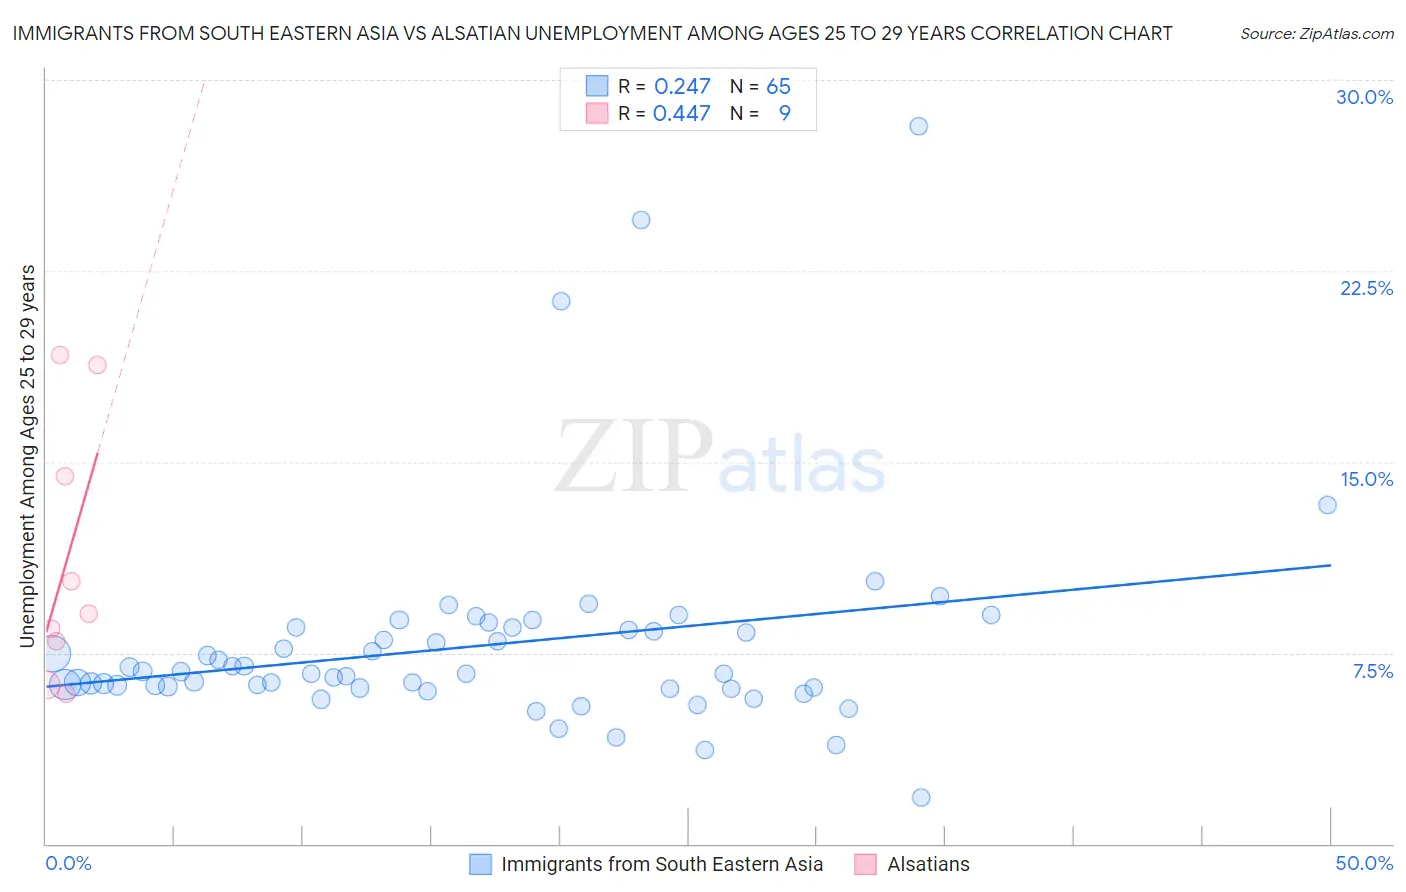
Immigrants from South Eastern Asia vs Alsatian Unemployment Among Ages 25 to 29 years Correlation Chart
The statistical analysis conducted on geographies consisting of 474,351,978 people shows a weak positive correlation between the proportion of Immigrants from South Eastern Asia and unemployment rate among population between the ages 25 and 29 in the United States with a correlation coefficient (R) of 0.247 and weighted average of 6.7%. Similarly, the statistical analysis conducted on geographies consisting of 80,994,703 people shows a moderate positive correlation between the proportion of Alsatians and unemployment rate among population between the ages 25 and 29 in the United States with a correlation coefficient (R) of 0.447 and weighted average of 6.7%, a difference of 1.4%.
Unemployment Among Ages 25 to 29 years Correlation Summary
| Measurement | Immigrants from South Eastern Asia | Alsatian |
| Minimum | 1.8% | 5.9% |
| Maximum | 28.2% | 19.2% |
| Range | 26.4% | 13.3% |
| Mean | 7.8% | 11.1% |
| Median | 6.7% | 9.0% |
| Interquartile 25% (IQ1) | 6.1% | 7.1% |
| Interquartile 75% (IQ3) | 8.4% | 16.6% |
| Interquartile Range (IQR) | 2.3% | 9.5% |
| Standard Deviation (Sample) | 4.2% | 5.1% |
| Standard Deviation (Population) | 4.1% | 4.8% |
Demographics Similar to Immigrants from South Eastern Asia and Alsatians by Unemployment Among Ages 25 to 29 years
In terms of unemployment among ages 25 to 29 years, the demographic groups most similar to Immigrants from South Eastern Asia are Immigrants from North America (6.6%, a difference of 0.060%), Osage (6.7%, a difference of 0.060%), Immigrants from Israel (6.7%, a difference of 0.080%), Immigrants from Iraq (6.7%, a difference of 0.24%), and Costa Rican (6.7%, a difference of 0.26%). Similarly, the demographic groups most similar to Alsatians are Immigrants from Greece (6.7%, a difference of 0.0%), Immigrants from Ukraine (6.7%, a difference of 0.040%), Chickasaw (6.7%, a difference of 0.050%), Korean (6.7%, a difference of 0.090%), and Argentinean (6.7%, a difference of 0.29%).
| Demographics | Rating | Rank | Unemployment Among Ages 25 to 29 years |
| Immigrants | North America | 50.0 /100 | #174 | Average 6.6% |
| Immigrants | South Eastern Asia | 49.1 /100 | #175 | Average 6.7% |
| Osage | 48.1 /100 | #176 | Average 6.7% |
| Immigrants | Israel | 47.8 /100 | #177 | Average 6.7% |
| Immigrants | Iraq | 45.1 /100 | #178 | Average 6.7% |
| Costa Ricans | 44.9 /100 | #179 | Average 6.7% |
| Immigrants | Africa | 41.1 /100 | #180 | Average 6.7% |
| Immigrants | Western Europe | 41.1 /100 | #181 | Average 6.7% |
| Czechoslovakians | 40.7 /100 | #182 | Average 6.7% |
| Immigrants | Scotland | 39.6 /100 | #183 | Fair 6.7% |
| Immigrants | Costa Rica | 38.3 /100 | #184 | Fair 6.7% |
| Moroccans | 35.9 /100 | #185 | Fair 6.7% |
| Immigrants | Iran | 34.4 /100 | #186 | Fair 6.7% |
| Immigrants | South America | 33.0 /100 | #187 | Fair 6.7% |
| Irish | 32.8 /100 | #188 | Fair 6.7% |
| Argentineans | 32.1 /100 | #189 | Fair 6.7% |
| Koreans | 29.3 /100 | #190 | Fair 6.7% |
| Chickasaw | 28.7 /100 | #191 | Fair 6.7% |
| Immigrants | Ukraine | 28.6 /100 | #192 | Fair 6.7% |
| Alsatians | 28.1 /100 | #193 | Fair 6.7% |
| Immigrants | Greece | 28.0 /100 | #194 | Fair 6.7% |