Immigrants from Congo vs Immigrants from Ghana Unemployment Among Ages 25 to 29 years
COMPARE
Immigrants from Congo
Immigrants from Ghana
Unemployment Among Ages 25 to 29 years
Unemployment Among Ages 25 to 29 years Comparison
Immigrants from Congo
Immigrants from Ghana
6.4%
UNEMPLOYMENT AMONG AGES 25 TO 29 YEARS
90.4/ 100
METRIC RATING
103rd/ 347
METRIC RANK
7.5%
UNEMPLOYMENT AMONG AGES 25 TO 29 YEARS
0.0/ 100
METRIC RATING
275th/ 347
METRIC RANK
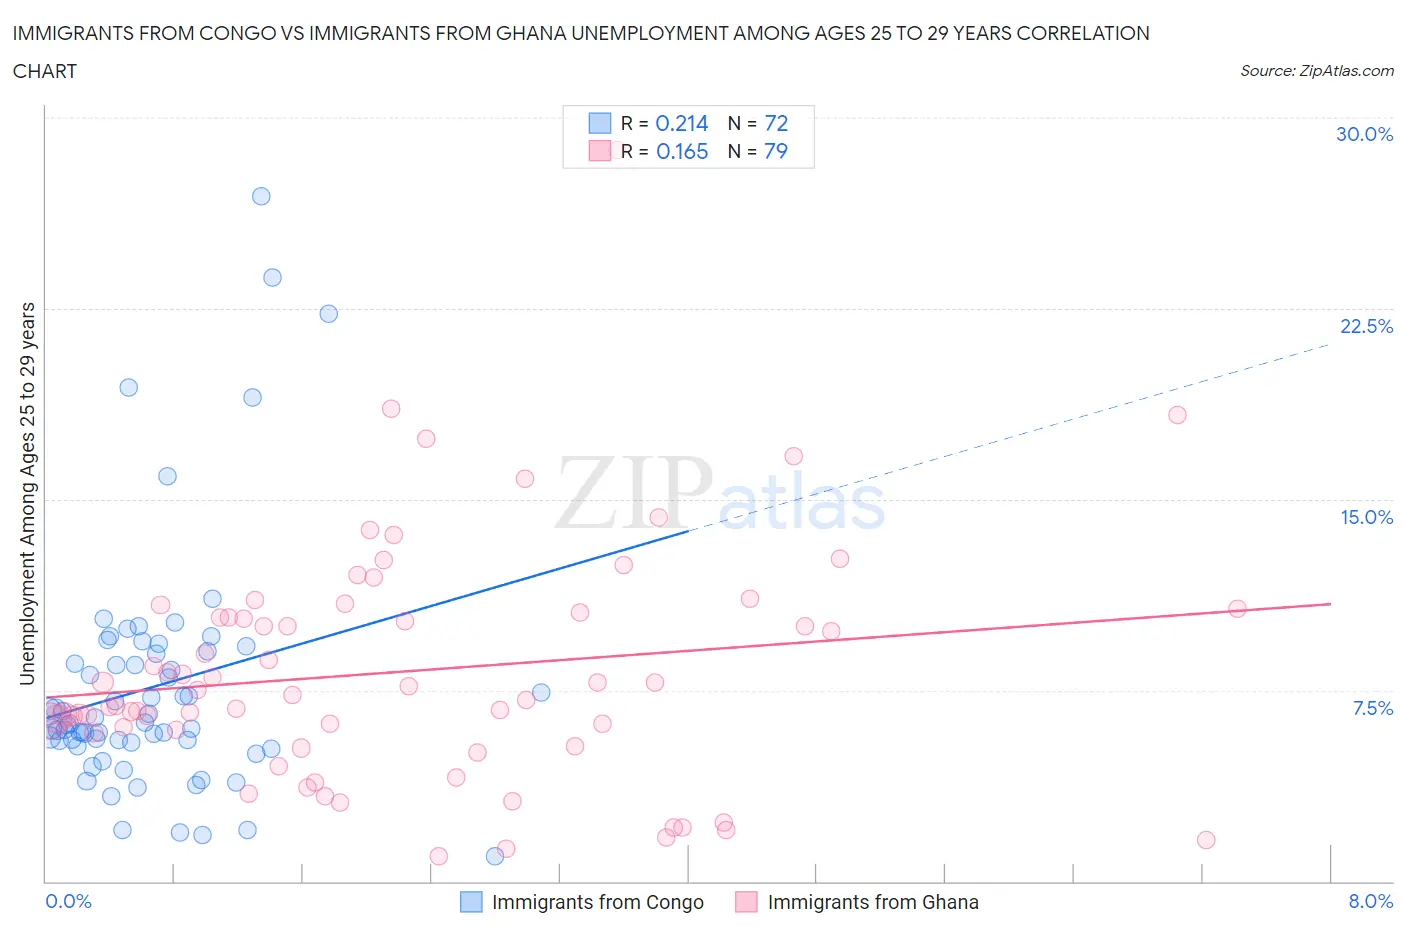
Immigrants from Congo vs Immigrants from Ghana Unemployment Among Ages 25 to 29 years Correlation Chart
The statistical analysis conducted on geographies consisting of 91,198,685 people shows a weak positive correlation between the proportion of Immigrants from Congo and unemployment rate among population between the ages 25 and 29 in the United States with a correlation coefficient (R) of 0.214 and weighted average of 6.4%. Similarly, the statistical analysis conducted on geographies consisting of 195,845,619 people shows a poor positive correlation between the proportion of Immigrants from Ghana and unemployment rate among population between the ages 25 and 29 in the United States with a correlation coefficient (R) of 0.165 and weighted average of 7.5%, a difference of 16.6%.
Unemployment Among Ages 25 to 29 years Correlation Summary
| Measurement | Immigrants from Congo | Immigrants from Ghana |
| Minimum | 1.0% | 0.96% |
| Maximum | 26.9% | 28.7% |
| Range | 25.9% | 27.7% |
| Mean | 7.6% | 8.2% |
| Median | 6.2% | 7.3% |
| Interquartile 25% (IQ1) | 5.5% | 5.8% |
| Interquartile 75% (IQ3) | 9.0% | 10.6% |
| Interquartile Range (IQR) | 3.5% | 4.7% |
| Standard Deviation (Sample) | 4.8% | 4.7% |
| Standard Deviation (Population) | 4.8% | 4.6% |
Similar Demographics by Unemployment Among Ages 25 to 29 years
Demographics Similar to Immigrants from Congo by Unemployment Among Ages 25 to 29 years
In terms of unemployment among ages 25 to 29 years, the demographic groups most similar to Immigrants from Congo are British (6.4%, a difference of 0.020%), Cypriot (6.4%, a difference of 0.060%), Immigrants from Kazakhstan (6.4%, a difference of 0.10%), Immigrants from Ireland (6.4%, a difference of 0.14%), and Uruguayan (6.4%, a difference of 0.15%).
| Demographics | Rating | Rank | Unemployment Among Ages 25 to 29 years |
| Immigrants | Brazil | 92.1 /100 | #96 | Exceptional 6.4% |
| Immigrants | Eastern Europe | 91.9 /100 | #97 | Exceptional 6.4% |
| Serbians | 91.7 /100 | #98 | Exceptional 6.4% |
| Iraqis | 91.3 /100 | #99 | Exceptional 6.4% |
| Uruguayans | 91.2 /100 | #100 | Exceptional 6.4% |
| Immigrants | Ireland | 91.1 /100 | #101 | Exceptional 6.4% |
| British | 90.5 /100 | #102 | Exceptional 6.4% |
| Immigrants | Congo | 90.4 /100 | #103 | Exceptional 6.4% |
| Cypriots | 90.1 /100 | #104 | Exceptional 6.4% |
| Immigrants | Kazakhstan | 89.8 /100 | #105 | Excellent 6.4% |
| Immigrants | Hungary | 89.4 /100 | #106 | Excellent 6.4% |
| Swiss | 88.6 /100 | #107 | Excellent 6.4% |
| Croatians | 88.2 /100 | #108 | Excellent 6.4% |
| Immigrants | Albania | 87.9 /100 | #109 | Excellent 6.4% |
| Europeans | 87.8 /100 | #110 | Excellent 6.4% |
Demographics Similar to Immigrants from Ghana by Unemployment Among Ages 25 to 29 years
In terms of unemployment among ages 25 to 29 years, the demographic groups most similar to Immigrants from Ghana are Immigrants from Central America (7.5%, a difference of 0.080%), Immigrants from Nigeria (7.5%, a difference of 0.29%), Immigrants from Bahamas (7.5%, a difference of 0.32%), French American Indian (7.5%, a difference of 0.34%), and Choctaw (7.5%, a difference of 0.37%).
| Demographics | Rating | Rank | Unemployment Among Ages 25 to 29 years |
| Immigrants | Ecuador | 0.1 /100 | #268 | Tragic 7.4% |
| Immigrants | Latin America | 0.1 /100 | #269 | Tragic 7.4% |
| Bahamians | 0.0 /100 | #270 | Tragic 7.5% |
| Choctaw | 0.0 /100 | #271 | Tragic 7.5% |
| Immigrants | Bahamas | 0.0 /100 | #272 | Tragic 7.5% |
| Immigrants | Nigeria | 0.0 /100 | #273 | Tragic 7.5% |
| Immigrants | Central America | 0.0 /100 | #274 | Tragic 7.5% |
| Immigrants | Ghana | 0.0 /100 | #275 | Tragic 7.5% |
| French American Indians | 0.0 /100 | #276 | Tragic 7.5% |
| Iroquois | 0.0 /100 | #277 | Tragic 7.5% |
| Mexicans | 0.0 /100 | #278 | Tragic 7.5% |
| Nepalese | 0.0 /100 | #279 | Tragic 7.5% |
| Immigrants | Caribbean | 0.0 /100 | #280 | Tragic 7.5% |
| Immigrants | Bangladesh | 0.0 /100 | #281 | Tragic 7.5% |
| Immigrants | Senegal | 0.0 /100 | #282 | Tragic 7.6% |