Immigrants from Congo vs Immigrants from Somalia Unemployment Among Ages 25 to 29 years
COMPARE
Immigrants from Congo
Immigrants from Somalia
Unemployment Among Ages 25 to 29 years
Unemployment Among Ages 25 to 29 years Comparison
Immigrants from Congo
Immigrants from Somalia
6.4%
UNEMPLOYMENT AMONG AGES 25 TO 29 YEARS
90.4/ 100
METRIC RATING
103rd/ 347
METRIC RANK
5.5%
UNEMPLOYMENT AMONG AGES 25 TO 29 YEARS
100.0/ 100
METRIC RATING
3rd/ 347
METRIC RANK
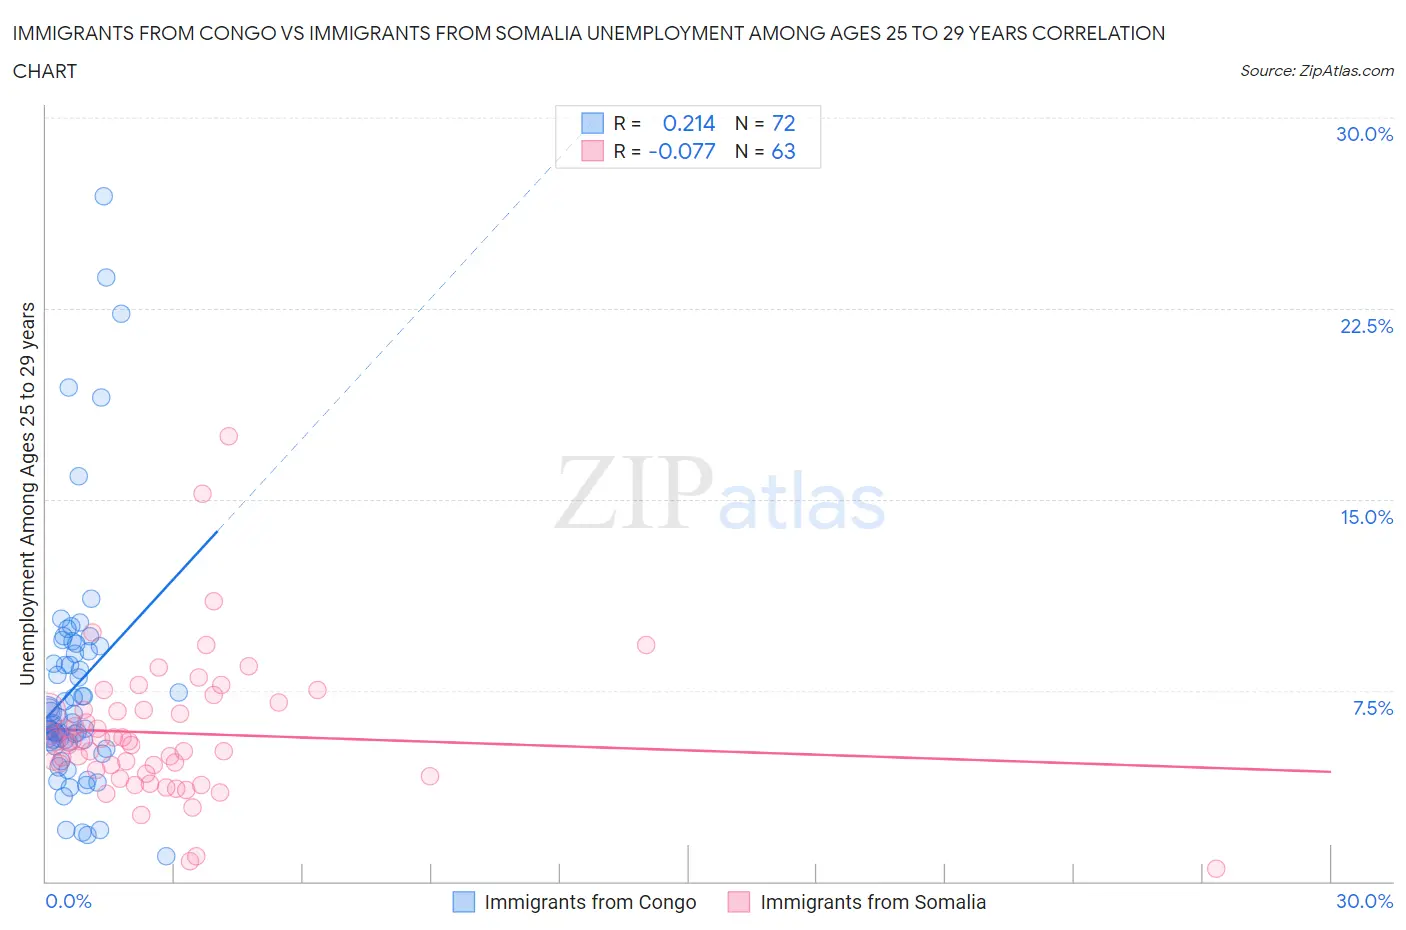
Immigrants from Congo vs Immigrants from Somalia Unemployment Among Ages 25 to 29 years Correlation Chart
The statistical analysis conducted on geographies consisting of 91,198,685 people shows a weak positive correlation between the proportion of Immigrants from Congo and unemployment rate among population between the ages 25 and 29 in the United States with a correlation coefficient (R) of 0.214 and weighted average of 6.4%. Similarly, the statistical analysis conducted on geographies consisting of 91,266,835 people shows a slight negative correlation between the proportion of Immigrants from Somalia and unemployment rate among population between the ages 25 and 29 in the United States with a correlation coefficient (R) of -0.077 and weighted average of 5.5%, a difference of 16.0%.
Unemployment Among Ages 25 to 29 years Correlation Summary
| Measurement | Immigrants from Congo | Immigrants from Somalia |
| Minimum | 1.0% | 0.50% |
| Maximum | 26.9% | 17.5% |
| Range | 25.9% | 17.0% |
| Mean | 7.6% | 5.8% |
| Median | 6.2% | 5.5% |
| Interquartile 25% (IQ1) | 5.5% | 4.2% |
| Interquartile 75% (IQ3) | 9.0% | 6.7% |
| Interquartile Range (IQR) | 3.5% | 2.5% |
| Standard Deviation (Sample) | 4.8% | 2.8% |
| Standard Deviation (Population) | 4.8% | 2.8% |
Similar Demographics by Unemployment Among Ages 25 to 29 years
Demographics Similar to Immigrants from Congo by Unemployment Among Ages 25 to 29 years
In terms of unemployment among ages 25 to 29 years, the demographic groups most similar to Immigrants from Congo are British (6.4%, a difference of 0.020%), Cypriot (6.4%, a difference of 0.060%), Immigrants from Kazakhstan (6.4%, a difference of 0.10%), Immigrants from Ireland (6.4%, a difference of 0.14%), and Uruguayan (6.4%, a difference of 0.15%).
| Demographics | Rating | Rank | Unemployment Among Ages 25 to 29 years |
| Immigrants | Brazil | 92.1 /100 | #96 | Exceptional 6.4% |
| Immigrants | Eastern Europe | 91.9 /100 | #97 | Exceptional 6.4% |
| Serbians | 91.7 /100 | #98 | Exceptional 6.4% |
| Iraqis | 91.3 /100 | #99 | Exceptional 6.4% |
| Uruguayans | 91.2 /100 | #100 | Exceptional 6.4% |
| Immigrants | Ireland | 91.1 /100 | #101 | Exceptional 6.4% |
| British | 90.5 /100 | #102 | Exceptional 6.4% |
| Immigrants | Congo | 90.4 /100 | #103 | Exceptional 6.4% |
| Cypriots | 90.1 /100 | #104 | Exceptional 6.4% |
| Immigrants | Kazakhstan | 89.8 /100 | #105 | Excellent 6.4% |
| Immigrants | Hungary | 89.4 /100 | #106 | Excellent 6.4% |
| Swiss | 88.6 /100 | #107 | Excellent 6.4% |
| Croatians | 88.2 /100 | #108 | Excellent 6.4% |
| Immigrants | Albania | 87.9 /100 | #109 | Excellent 6.4% |
| Europeans | 87.8 /100 | #110 | Excellent 6.4% |
Demographics Similar to Immigrants from Somalia by Unemployment Among Ages 25 to 29 years
In terms of unemployment among ages 25 to 29 years, the demographic groups most similar to Immigrants from Somalia are Tongan (5.5%, a difference of 0.31%), Immigrants from Cuba (5.6%, a difference of 2.1%), Somali (5.6%, a difference of 2.1%), Hmong (5.7%, a difference of 2.3%), and Immigrants from India (5.7%, a difference of 2.4%).
| Demographics | Rating | Rank | Unemployment Among Ages 25 to 29 years |
| Sudanese | 100.0 /100 | #1 | Exceptional 5.4% |
| Tongans | 100.0 /100 | #2 | Exceptional 5.5% |
| Immigrants | Somalia | 100.0 /100 | #3 | Exceptional 5.5% |
| Immigrants | Cuba | 100.0 /100 | #4 | Exceptional 5.6% |
| Somalis | 100.0 /100 | #5 | Exceptional 5.6% |
| Hmong | 100.0 /100 | #6 | Exceptional 5.7% |
| Immigrants | India | 100.0 /100 | #7 | Exceptional 5.7% |
| Immigrants | Bosnia and Herzegovina | 100.0 /100 | #8 | Exceptional 5.7% |
| Immigrants | Nepal | 100.0 /100 | #9 | Exceptional 5.7% |
| Immigrants | Sudan | 100.0 /100 | #10 | Exceptional 5.8% |
| Cambodians | 100.0 /100 | #11 | Exceptional 5.8% |
| Okinawans | 100.0 /100 | #12 | Exceptional 5.9% |
| Immigrants | Bolivia | 100.0 /100 | #13 | Exceptional 5.9% |
| Immigrants | Kuwait | 99.9 /100 | #14 | Exceptional 5.9% |
| Cubans | 99.9 /100 | #15 | Exceptional 5.9% |