Immigrants from Colombia vs Ute Unemployment Among Ages 20 to 24 years
COMPARE
Immigrants from Colombia
Ute
Unemployment Among Ages 20 to 24 years
Unemployment Among Ages 20 to 24 years Comparison
Immigrants from Colombia
Ute
10.3%
UNEMPLOYMENT AMONG AGES 20 TO 24 YEARS
56.3/ 100
METRIC RATING
169th/ 347
METRIC RANK
11.2%
UNEMPLOYMENT AMONG AGES 20 TO 24 YEARS
0.0/ 100
METRIC RATING
269th/ 347
METRIC RANK
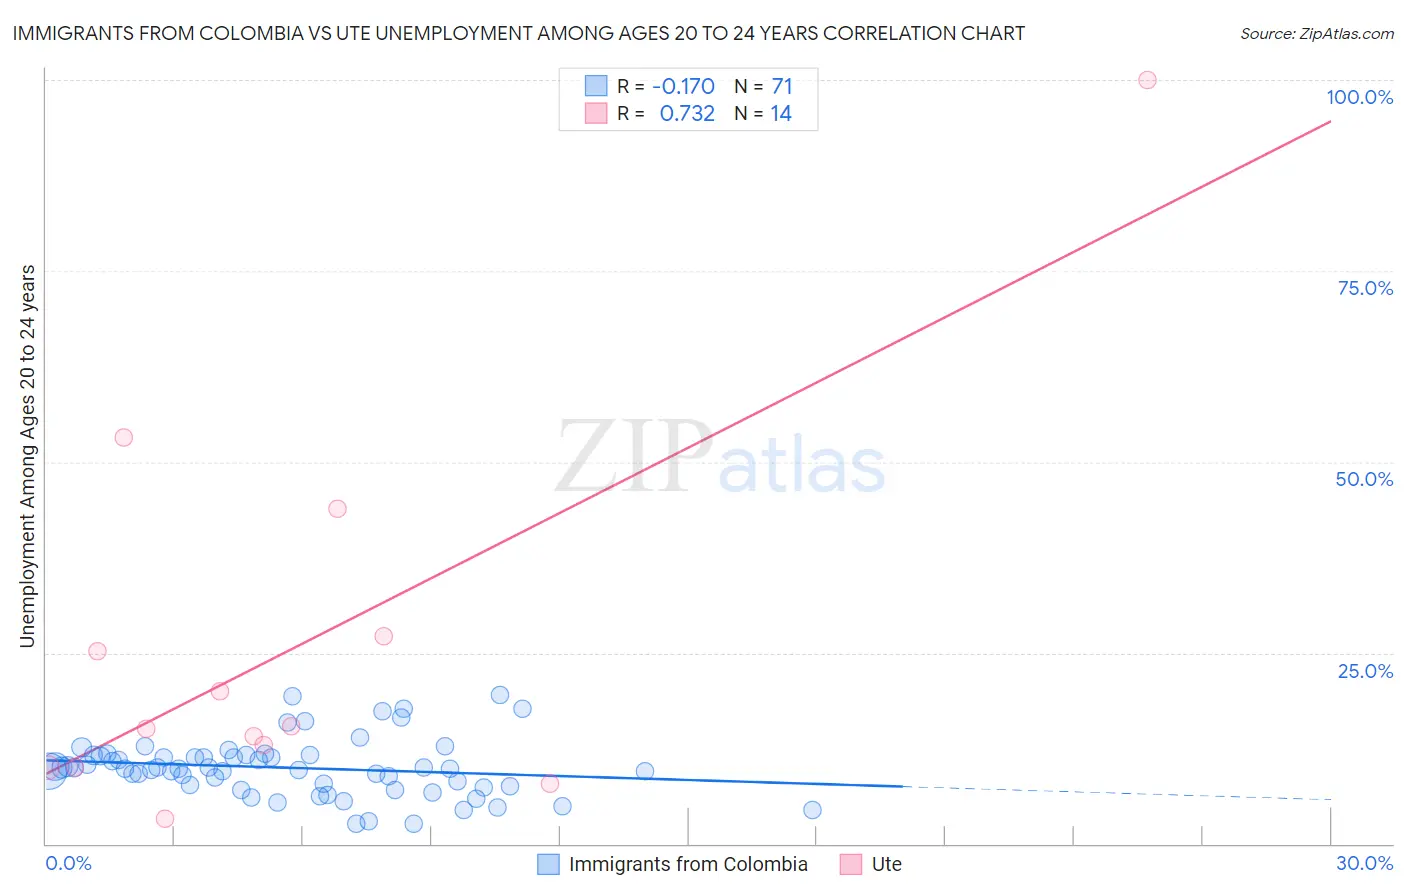
Immigrants from Colombia vs Ute Unemployment Among Ages 20 to 24 years Correlation Chart
The statistical analysis conducted on geographies consisting of 369,036,821 people shows a poor negative correlation between the proportion of Immigrants from Colombia and unemployment rate among population between the ages 20 and 24 in the United States with a correlation coefficient (R) of -0.170 and weighted average of 10.3%. Similarly, the statistical analysis conducted on geographies consisting of 55,243,819 people shows a strong positive correlation between the proportion of Ute and unemployment rate among population between the ages 20 and 24 in the United States with a correlation coefficient (R) of 0.732 and weighted average of 11.2%, a difference of 9.1%.
Unemployment Among Ages 20 to 24 years Correlation Summary
| Measurement | Immigrants from Colombia | Ute |
| Minimum | 2.6% | 3.2% |
| Maximum | 19.4% | 100.0% |
| Range | 16.8% | 96.8% |
| Mean | 9.9% | 25.6% |
| Median | 9.9% | 15.2% |
| Interquartile 25% (IQ1) | 7.6% | 10.0% |
| Interquartile 75% (IQ3) | 11.6% | 27.1% |
| Interquartile Range (IQR) | 4.0% | 17.1% |
| Standard Deviation (Sample) | 3.7% | 25.5% |
| Standard Deviation (Population) | 3.7% | 24.6% |
Similar Demographics by Unemployment Among Ages 20 to 24 years
Demographics Similar to Immigrants from Colombia by Unemployment Among Ages 20 to 24 years
In terms of unemployment among ages 20 to 24 years, the demographic groups most similar to Immigrants from Colombia are Iraqi (10.3%, a difference of 0.020%), Turkish (10.3%, a difference of 0.040%), Italian (10.3%, a difference of 0.050%), Immigrants from Fiji (10.3%, a difference of 0.050%), and Lebanese (10.3%, a difference of 0.070%).
| Demographics | Rating | Rank | Unemployment Among Ages 20 to 24 years |
| Immigrants | Asia | 61.3 /100 | #162 | Good 10.3% |
| Estonians | 61.1 /100 | #163 | Good 10.3% |
| Immigrants | Korea | 59.0 /100 | #164 | Average 10.3% |
| Lebanese | 58.3 /100 | #165 | Average 10.3% |
| Italians | 57.7 /100 | #166 | Average 10.3% |
| Immigrants | Fiji | 57.6 /100 | #167 | Average 10.3% |
| Iraqis | 56.7 /100 | #168 | Average 10.3% |
| Immigrants | Colombia | 56.3 /100 | #169 | Average 10.3% |
| Turks | 55.2 /100 | #170 | Average 10.3% |
| Immigrants | Eastern Asia | 52.7 /100 | #171 | Average 10.3% |
| Koreans | 51.9 /100 | #172 | Average 10.3% |
| Immigrants | Sweden | 50.8 /100 | #173 | Average 10.3% |
| Ukrainians | 50.0 /100 | #174 | Average 10.3% |
| Samoans | 45.4 /100 | #175 | Average 10.3% |
| Potawatomi | 42.0 /100 | #176 | Average 10.3% |
Demographics Similar to Ute by Unemployment Among Ages 20 to 24 years
In terms of unemployment among ages 20 to 24 years, the demographic groups most similar to Ute are Maltese (11.2%, a difference of 0.39%), Delaware (11.3%, a difference of 0.58%), Immigrants from Greece (11.1%, a difference of 0.83%), Immigrants from Liberia (11.1%, a difference of 1.1%), and Immigrants from Ireland (11.1%, a difference of 1.2%).
| Demographics | Rating | Rank | Unemployment Among Ages 20 to 24 years |
| Immigrants | Latin America | 0.1 /100 | #262 | Tragic 11.0% |
| Marshallese | 0.1 /100 | #263 | Tragic 11.0% |
| Sub-Saharan Africans | 0.0 /100 | #264 | Tragic 11.1% |
| Immigrants | Ireland | 0.0 /100 | #265 | Tragic 11.1% |
| Immigrants | Liberia | 0.0 /100 | #266 | Tragic 11.1% |
| Immigrants | Greece | 0.0 /100 | #267 | Tragic 11.1% |
| Maltese | 0.0 /100 | #268 | Tragic 11.2% |
| Ute | 0.0 /100 | #269 | Tragic 11.2% |
| Delaware | 0.0 /100 | #270 | Tragic 11.3% |
| Immigrants | Uzbekistan | 0.0 /100 | #271 | Tragic 11.4% |
| Nigerians | 0.0 /100 | #272 | Tragic 11.4% |
| Immigrants | Nigeria | 0.0 /100 | #273 | Tragic 11.5% |
| Cape Verdeans | 0.0 /100 | #274 | Tragic 11.5% |
| Senegalese | 0.0 /100 | #275 | Tragic 11.5% |
| Sierra Leoneans | 0.0 /100 | #276 | Tragic 11.5% |