Immigrants from Yemen vs Immigrants from Romania Male Unemployment
COMPARE
Immigrants from Yemen
Immigrants from Romania
Male Unemployment
Male Unemployment Comparison
Immigrants from Yemen
Immigrants from Romania
7.8%
MALE UNEMPLOYMENT
0.0/ 100
METRIC RATING
329th/ 347
METRIC RANK
5.1%
MALE UNEMPLOYMENT
95.4/ 100
METRIC RATING
87th/ 347
METRIC RANK
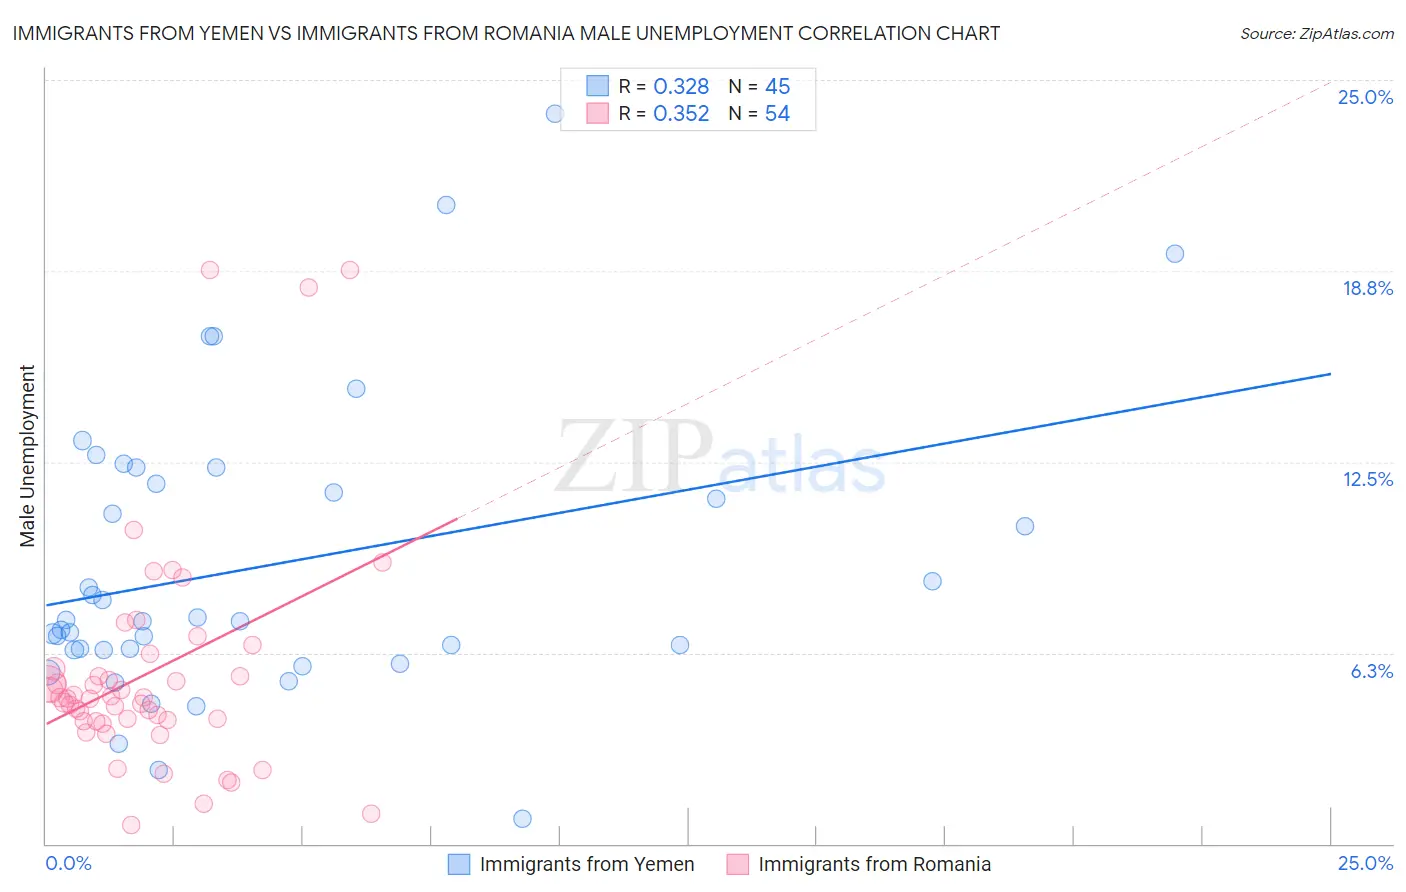
Immigrants from Yemen vs Immigrants from Romania Male Unemployment Correlation Chart
The statistical analysis conducted on geographies consisting of 82,399,512 people shows a mild positive correlation between the proportion of Immigrants from Yemen and unemployment rate among males in the United States with a correlation coefficient (R) of 0.328 and weighted average of 7.8%. Similarly, the statistical analysis conducted on geographies consisting of 256,547,728 people shows a mild positive correlation between the proportion of Immigrants from Romania and unemployment rate among males in the United States with a correlation coefficient (R) of 0.352 and weighted average of 5.1%, a difference of 53.9%.
Male Unemployment Correlation Summary
| Measurement | Immigrants from Yemen | Immigrants from Romania |
| Minimum | 0.80% | 0.60% |
| Maximum | 23.9% | 18.8% |
| Range | 23.1% | 18.2% |
| Mean | 9.1% | 5.6% |
| Median | 7.3% | 4.8% |
| Interquartile 25% (IQ1) | 6.3% | 4.0% |
| Interquartile 75% (IQ3) | 12.1% | 5.7% |
| Interquartile Range (IQR) | 5.7% | 1.7% |
| Standard Deviation (Sample) | 4.8% | 3.8% |
| Standard Deviation (Population) | 4.8% | 3.7% |
Similar Demographics by Male Unemployment
Demographics Similar to Immigrants from Yemen by Male Unemployment
In terms of male unemployment, the demographic groups most similar to Immigrants from Yemen are Native/Alaskan (7.7%, a difference of 0.90%), Paiute (7.7%, a difference of 1.3%), Yakama (7.9%, a difference of 1.8%), Immigrants from Dominican Republic (7.6%, a difference of 2.4%), and Shoshone (7.6%, a difference of 2.5%).
| Demographics | Rating | Rank | Male Unemployment |
| Immigrants | Cabo Verde | 0.0 /100 | #322 | Tragic 7.5% |
| Immigrants | Grenada | 0.0 /100 | #323 | Tragic 7.6% |
| Dominicans | 0.0 /100 | #324 | Tragic 7.6% |
| Shoshone | 0.0 /100 | #325 | Tragic 7.6% |
| Immigrants | Dominican Republic | 0.0 /100 | #326 | Tragic 7.6% |
| Paiute | 0.0 /100 | #327 | Tragic 7.7% |
| Natives/Alaskans | 0.0 /100 | #328 | Tragic 7.7% |
| Immigrants | Yemen | 0.0 /100 | #329 | Tragic 7.8% |
| Yakama | 0.0 /100 | #330 | Tragic 7.9% |
| Alaska Natives | 0.0 /100 | #331 | Tragic 8.1% |
| Pima | 0.0 /100 | #332 | Tragic 8.3% |
| Sioux | 0.0 /100 | #333 | Tragic 8.4% |
| Tsimshian | 0.0 /100 | #334 | Tragic 8.5% |
| Pueblo | 0.0 /100 | #335 | Tragic 8.5% |
| Yuman | 0.0 /100 | #336 | Tragic 8.6% |
Demographics Similar to Immigrants from Romania by Male Unemployment
In terms of male unemployment, the demographic groups most similar to Immigrants from Romania are Maltese (5.1%, a difference of 0.020%), Immigrants from North Macedonia (5.1%, a difference of 0.060%), Serbian (5.1%, a difference of 0.11%), Immigrants from Sri Lanka (5.1%, a difference of 0.19%), and Immigrants from Eritrea (5.0%, a difference of 0.22%).
| Demographics | Rating | Rank | Male Unemployment |
| Argentineans | 96.2 /100 | #80 | Exceptional 5.0% |
| French | 96.2 /100 | #81 | Exceptional 5.0% |
| Chileans | 96.2 /100 | #82 | Exceptional 5.0% |
| Immigrants | Eritrea | 96.0 /100 | #83 | Exceptional 5.0% |
| Serbians | 95.7 /100 | #84 | Exceptional 5.1% |
| Immigrants | North Macedonia | 95.6 /100 | #85 | Exceptional 5.1% |
| Maltese | 95.5 /100 | #86 | Exceptional 5.1% |
| Immigrants | Romania | 95.4 /100 | #87 | Exceptional 5.1% |
| Immigrants | Sri Lanka | 94.9 /100 | #88 | Exceptional 5.1% |
| Immigrants | Australia | 94.7 /100 | #89 | Exceptional 5.1% |
| Okinawans | 94.7 /100 | #90 | Exceptional 5.1% |
| Immigrants | Turkey | 94.4 /100 | #91 | Exceptional 5.1% |
| Slavs | 94.2 /100 | #92 | Exceptional 5.1% |
| Immigrants | Serbia | 94.2 /100 | #93 | Exceptional 5.1% |
| Canadians | 94.1 /100 | #94 | Exceptional 5.1% |