Immigrants from Chile vs Immigrants from Armenia Unemployment Among Women with Children Ages 6 to 17 years
COMPARE
Immigrants from Chile
Immigrants from Armenia
Unemployment Among Women with Children Ages 6 to 17 years
Unemployment Among Women with Children Ages 6 to 17 years Comparison
Immigrants from Chile
Immigrants from Armenia
8.9%
UNEMPLOYMENT AMONG WOMEN WITH CHILDREN AGES 6 TO 17 YEARS
65.3/ 100
METRIC RATING
158th/ 347
METRIC RANK
8.2%
UNEMPLOYMENT AMONG WOMEN WITH CHILDREN AGES 6 TO 17 YEARS
100.0/ 100
METRIC RATING
54th/ 347
METRIC RANK
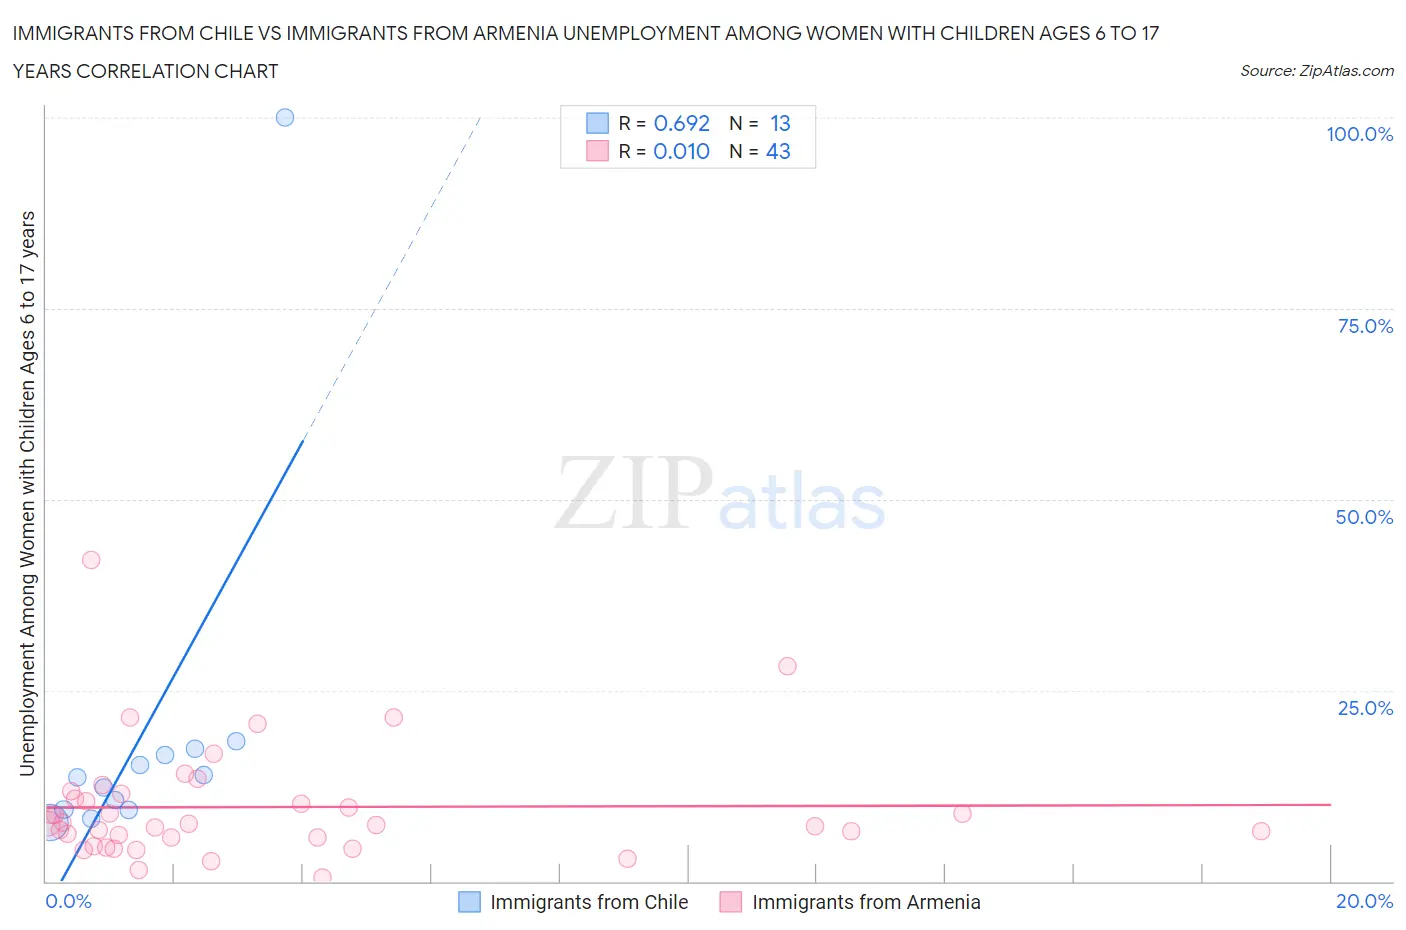
Immigrants from Chile vs Immigrants from Armenia Unemployment Among Women with Children Ages 6 to 17 years Correlation Chart
The statistical analysis conducted on geographies consisting of 175,273,874 people shows a significant positive correlation between the proportion of Immigrants from Chile and unemployment rate among women with children between the ages 6 and 17 in the United States with a correlation coefficient (R) of 0.692 and weighted average of 8.9%. Similarly, the statistical analysis conducted on geographies consisting of 85,380,605 people shows no correlation between the proportion of Immigrants from Armenia and unemployment rate among women with children between the ages 6 and 17 in the United States with a correlation coefficient (R) of 0.010 and weighted average of 8.2%, a difference of 9.1%.
Unemployment Among Women with Children Ages 6 to 17 years Correlation Summary
| Measurement | Immigrants from Chile | Immigrants from Armenia |
| Minimum | 7.8% | 0.50% |
| Maximum | 100.0% | 42.1% |
| Range | 92.2% | 41.6% |
| Mean | 19.4% | 9.7% |
| Median | 13.5% | 7.6% |
| Interquartile 25% (IQ1) | 9.3% | 5.8% |
| Interquartile 75% (IQ3) | 17.0% | 11.5% |
| Interquartile Range (IQR) | 7.7% | 5.7% |
| Standard Deviation (Sample) | 24.5% | 7.6% |
| Standard Deviation (Population) | 23.5% | 7.5% |
Similar Demographics by Unemployment Among Women with Children Ages 6 to 17 years
Demographics Similar to Immigrants from Chile by Unemployment Among Women with Children Ages 6 to 17 years
In terms of unemployment among women with children ages 6 to 17 years, the demographic groups most similar to Immigrants from Chile are Immigrants from Belgium (8.9%, a difference of 0.010%), Osage (8.9%, a difference of 0.030%), Spanish (8.9%, a difference of 0.070%), Immigrants from Hungary (8.9%, a difference of 0.090%), and Immigrants from Guyana (8.9%, a difference of 0.12%).
| Demographics | Rating | Rank | Unemployment Among Women with Children Ages 6 to 17 years |
| Immigrants | Eastern Africa | 74.6 /100 | #151 | Good 8.9% |
| Immigrants | Northern Europe | 74.6 /100 | #152 | Good 8.9% |
| Immigrants | Europe | 73.4 /100 | #153 | Good 8.9% |
| Vietnamese | 72.1 /100 | #154 | Good 8.9% |
| Immigrants | Greece | 71.8 /100 | #155 | Good 8.9% |
| Osage | 65.9 /100 | #156 | Good 8.9% |
| Immigrants | Belgium | 65.6 /100 | #157 | Good 8.9% |
| Immigrants | Chile | 65.3 /100 | #158 | Good 8.9% |
| Spanish | 63.8 /100 | #159 | Good 8.9% |
| Immigrants | Hungary | 63.4 /100 | #160 | Good 8.9% |
| Immigrants | Guyana | 63.0 /100 | #161 | Good 8.9% |
| Immigrants | Netherlands | 60.8 /100 | #162 | Good 8.9% |
| Mexican American Indians | 60.6 /100 | #163 | Good 8.9% |
| Ukrainians | 59.7 /100 | #164 | Average 8.9% |
| Immigrants | Micronesia | 59.2 /100 | #165 | Average 8.9% |
Demographics Similar to Immigrants from Armenia by Unemployment Among Women with Children Ages 6 to 17 years
In terms of unemployment among women with children ages 6 to 17 years, the demographic groups most similar to Immigrants from Armenia are Immigrants from Japan (8.2%, a difference of 0.060%), Immigrants from Bosnia and Herzegovina (8.2%, a difference of 0.070%), Immigrants from Laos (8.2%, a difference of 0.10%), Danish (8.1%, a difference of 0.22%), and Immigrants from Iraq (8.1%, a difference of 0.29%).
| Demographics | Rating | Rank | Unemployment Among Women with Children Ages 6 to 17 years |
| Immigrants | Switzerland | 100.0 /100 | #47 | Exceptional 8.1% |
| Immigrants | Asia | 100.0 /100 | #48 | Exceptional 8.1% |
| Immigrants | Oceania | 100.0 /100 | #49 | Exceptional 8.1% |
| Hawaiians | 100.0 /100 | #50 | Exceptional 8.1% |
| Immigrants | Sudan | 100.0 /100 | #51 | Exceptional 8.1% |
| Immigrants | Iraq | 100.0 /100 | #52 | Exceptional 8.1% |
| Danes | 100.0 /100 | #53 | Exceptional 8.1% |
| Immigrants | Armenia | 100.0 /100 | #54 | Exceptional 8.2% |
| Immigrants | Japan | 100.0 /100 | #55 | Exceptional 8.2% |
| Immigrants | Bosnia and Herzegovina | 100.0 /100 | #56 | Exceptional 8.2% |
| Immigrants | Laos | 100.0 /100 | #57 | Exceptional 8.2% |
| Immigrants | Malaysia | 100.0 /100 | #58 | Exceptional 8.2% |
| Immigrants | Philippines | 100.0 /100 | #59 | Exceptional 8.2% |
| Basques | 100.0 /100 | #60 | Exceptional 8.2% |
| Koreans | 100.0 /100 | #61 | Exceptional 8.2% |