Immigrants from Central America vs Ghanaian Unemployment Among Women with Children Under 6 years
COMPARE
Immigrants from Central America
Ghanaian
Unemployment Among Women with Children Under 6 years
Unemployment Among Women with Children Under 6 years Comparison
Immigrants from Central America
Ghanaians
8.9%
UNEMPLOYMENT AMONG WOMEN WITH CHILDREN UNDER 6 YEARS
0.0/ 100
METRIC RATING
295th/ 347
METRIC RANK
8.2%
UNEMPLOYMENT AMONG WOMEN WITH CHILDREN UNDER 6 YEARS
1.0/ 100
METRIC RATING
252nd/ 347
METRIC RANK
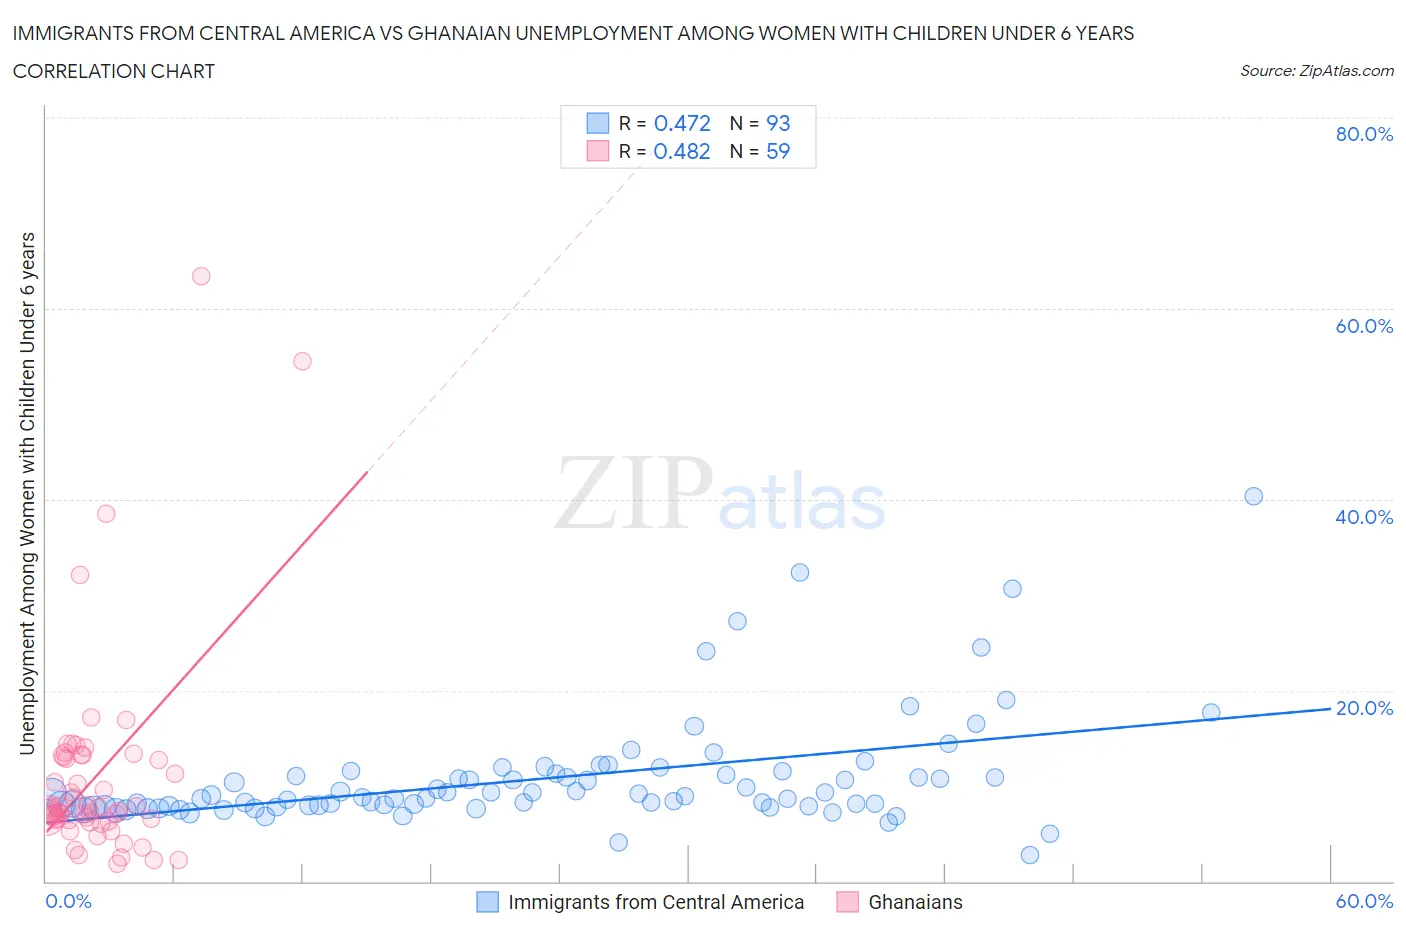
Immigrants from Central America vs Ghanaian Unemployment Among Women with Children Under 6 years Correlation Chart
The statistical analysis conducted on geographies consisting of 368,932,426 people shows a moderate positive correlation between the proportion of Immigrants from Central America and unemployment rate among women with children under the age of 6 in the United States with a correlation coefficient (R) of 0.472 and weighted average of 8.9%. Similarly, the statistical analysis conducted on geographies consisting of 165,389,442 people shows a moderate positive correlation between the proportion of Ghanaians and unemployment rate among women with children under the age of 6 in the United States with a correlation coefficient (R) of 0.482 and weighted average of 8.2%, a difference of 7.5%.
Unemployment Among Women with Children Under 6 years Correlation Summary
| Measurement | Immigrants from Central America | Ghanaian |
| Minimum | 2.7% | 1.8% |
| Maximum | 40.4% | 63.4% |
| Range | 37.7% | 61.6% |
| Mean | 10.8% | 11.0% |
| Median | 8.9% | 7.6% |
| Interquartile 25% (IQ1) | 7.8% | 6.5% |
| Interquartile 75% (IQ3) | 11.2% | 13.2% |
| Interquartile Range (IQR) | 3.4% | 6.7% |
| Standard Deviation (Sample) | 5.9% | 11.0% |
| Standard Deviation (Population) | 5.9% | 10.9% |
Similar Demographics by Unemployment Among Women with Children Under 6 years
Demographics Similar to Immigrants from Central America by Unemployment Among Women with Children Under 6 years
In terms of unemployment among women with children under 6 years, the demographic groups most similar to Immigrants from Central America are Nonimmigrants (8.8%, a difference of 0.050%), Immigrants from Dominican Republic (8.9%, a difference of 0.13%), Immigrants from Bangladesh (8.8%, a difference of 0.23%), Mexican (8.9%, a difference of 0.23%), and Tlingit-Haida (8.9%, a difference of 0.39%).
| Demographics | Rating | Rank | Unemployment Among Women with Children Under 6 years |
| Bahamians | 0.0 /100 | #288 | Tragic 8.7% |
| Iroquois | 0.0 /100 | #289 | Tragic 8.7% |
| Vietnamese | 0.0 /100 | #290 | Tragic 8.8% |
| Jamaicans | 0.0 /100 | #291 | Tragic 8.8% |
| Cheyenne | 0.0 /100 | #292 | Tragic 8.8% |
| Immigrants | Bangladesh | 0.0 /100 | #293 | Tragic 8.8% |
| Immigrants | Nonimmigrants | 0.0 /100 | #294 | Tragic 8.8% |
| Immigrants | Central America | 0.0 /100 | #295 | Tragic 8.9% |
| Immigrants | Dominican Republic | 0.0 /100 | #296 | Tragic 8.9% |
| Mexicans | 0.0 /100 | #297 | Tragic 8.9% |
| Tlingit-Haida | 0.0 /100 | #298 | Tragic 8.9% |
| Immigrants | Jamaica | 0.0 /100 | #299 | Tragic 8.9% |
| Creek | 0.0 /100 | #300 | Tragic 8.9% |
| Chickasaw | 0.0 /100 | #301 | Tragic 9.0% |
| Hispanics or Latinos | 0.0 /100 | #302 | Tragic 9.0% |
Demographics Similar to Ghanaians by Unemployment Among Women with Children Under 6 years
In terms of unemployment among women with children under 6 years, the demographic groups most similar to Ghanaians are Guyanese (8.2%, a difference of 0.0%), Nigerian (8.2%, a difference of 0.17%), Immigrants from Sierra Leone (8.2%, a difference of 0.18%), Immigrants from Guyana (8.2%, a difference of 0.18%), and Immigrants from Western Africa (8.2%, a difference of 0.27%).
| Demographics | Rating | Rank | Unemployment Among Women with Children Under 6 years |
| Native Hawaiians | 1.7 /100 | #245 | Tragic 8.2% |
| Central Americans | 1.4 /100 | #246 | Tragic 8.2% |
| German Russians | 1.2 /100 | #247 | Tragic 8.2% |
| Immigrants | Western Africa | 1.1 /100 | #248 | Tragic 8.2% |
| Immigrants | Sierra Leone | 1.1 /100 | #249 | Tragic 8.2% |
| Nigerians | 1.1 /100 | #250 | Tragic 8.2% |
| Guyanese | 1.0 /100 | #251 | Tragic 8.2% |
| Ghanaians | 1.0 /100 | #252 | Tragic 8.2% |
| Immigrants | Guyana | 0.8 /100 | #253 | Tragic 8.2% |
| Immigrants | Caribbean | 0.7 /100 | #254 | Tragic 8.3% |
| Immigrants | Portugal | 0.6 /100 | #255 | Tragic 8.3% |
| Celtics | 0.6 /100 | #256 | Tragic 8.3% |
| British West Indians | 0.5 /100 | #257 | Tragic 8.3% |
| Immigrants | Ghana | 0.5 /100 | #258 | Tragic 8.3% |
| Barbadians | 0.4 /100 | #259 | Tragic 8.3% |