Immigrants from Switzerland vs Nigerian Unemployment Among Ages 16 to 19 years
COMPARE
Immigrants from Switzerland
Nigerian
Unemployment Among Ages 16 to 19 years
Unemployment Among Ages 16 to 19 years Comparison
Immigrants from Switzerland
Nigerians
17.5%
UNEMPLOYMENT AMONG AGES 16 TO 19 YEARS
53.2/ 100
METRIC RATING
171st/ 347
METRIC RANK
18.9%
UNEMPLOYMENT AMONG AGES 16 TO 19 YEARS
0.2/ 100
METRIC RATING
260th/ 347
METRIC RANK
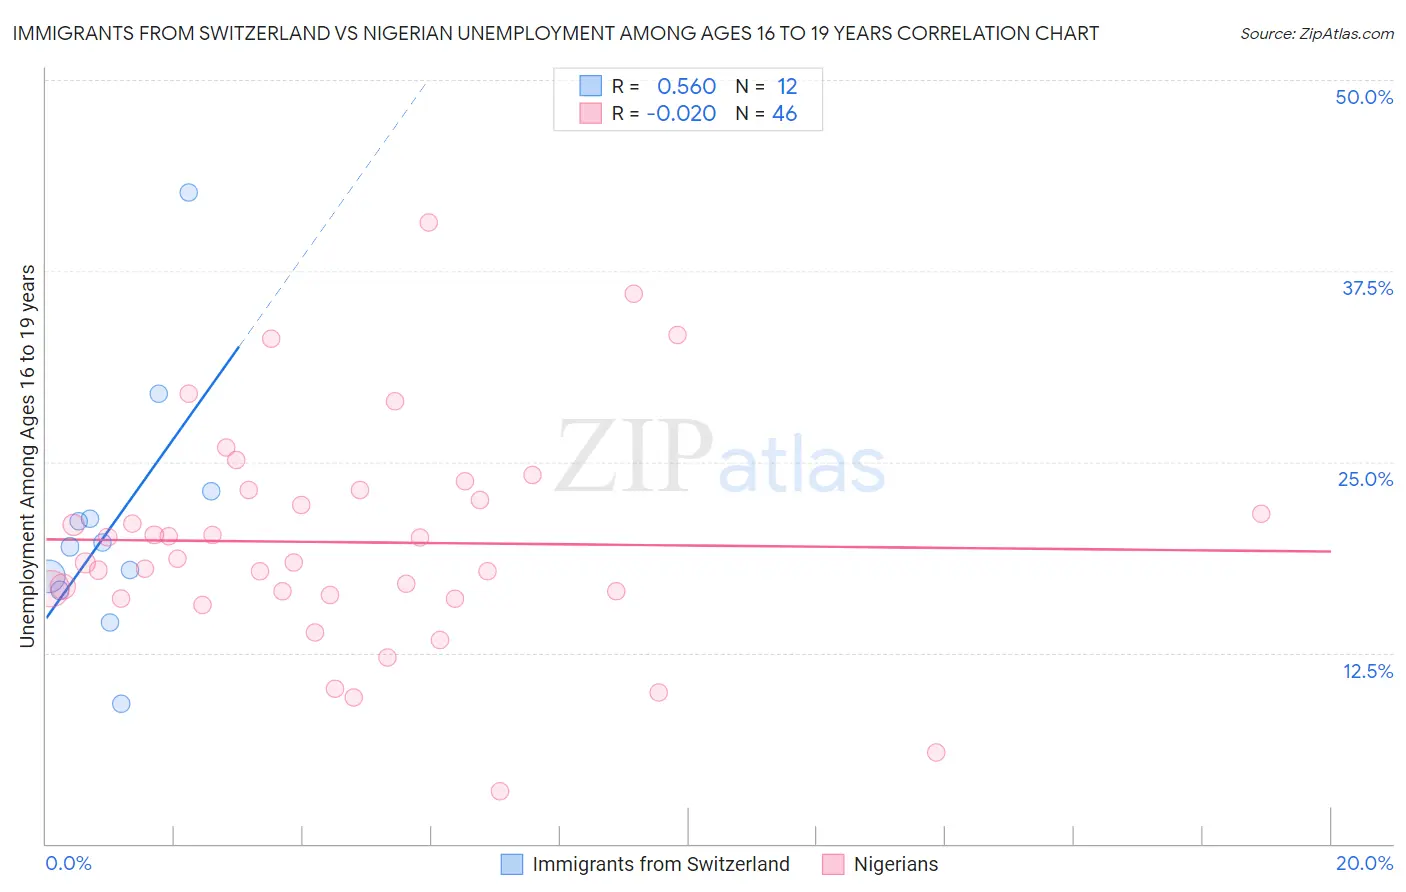
Immigrants from Switzerland vs Nigerian Unemployment Among Ages 16 to 19 years Correlation Chart
The statistical analysis conducted on geographies consisting of 143,539,212 people shows a substantial positive correlation between the proportion of Immigrants from Switzerland and unemployment rate among population between the ages 16 and 19 in the United States with a correlation coefficient (R) of 0.560 and weighted average of 17.5%. Similarly, the statistical analysis conducted on geographies consisting of 322,180,468 people shows no correlation between the proportion of Nigerians and unemployment rate among population between the ages 16 and 19 in the United States with a correlation coefficient (R) of -0.020 and weighted average of 18.9%, a difference of 7.8%.
Unemployment Among Ages 16 to 19 years Correlation Summary
| Measurement | Immigrants from Switzerland | Nigerian |
| Minimum | 9.2% | 3.4% |
| Maximum | 42.6% | 40.6% |
| Range | 33.4% | 37.2% |
| Mean | 21.0% | 19.7% |
| Median | 19.6% | 18.5% |
| Interquartile 25% (IQ1) | 17.0% | 16.3% |
| Interquartile 75% (IQ3) | 22.2% | 23.1% |
| Interquartile Range (IQR) | 5.2% | 6.8% |
| Standard Deviation (Sample) | 8.4% | 7.3% |
| Standard Deviation (Population) | 8.0% | 7.2% |
Similar Demographics by Unemployment Among Ages 16 to 19 years
Demographics Similar to Immigrants from Switzerland by Unemployment Among Ages 16 to 19 years
In terms of unemployment among ages 16 to 19 years, the demographic groups most similar to Immigrants from Switzerland are Immigrants from Romania (17.5%, a difference of 0.0%), Immigrants from Western Europe (17.6%, a difference of 0.050%), Immigrants from Cambodia (17.5%, a difference of 0.060%), Immigrants from Hungary (17.5%, a difference of 0.070%), and Immigrants from France (17.5%, a difference of 0.080%).
| Demographics | Rating | Rank | Unemployment Among Ages 16 to 19 years |
| Immigrants | Austria | 57.7 /100 | #164 | Average 17.5% |
| Cape Verdeans | 55.8 /100 | #165 | Average 17.5% |
| Immigrants | Italy | 55.2 /100 | #166 | Average 17.5% |
| Immigrants | France | 54.9 /100 | #167 | Average 17.5% |
| Immigrants | Hungary | 54.7 /100 | #168 | Average 17.5% |
| Immigrants | Cambodia | 54.5 /100 | #169 | Average 17.5% |
| Immigrants | Romania | 53.3 /100 | #170 | Average 17.5% |
| Immigrants | Switzerland | 53.2 /100 | #171 | Average 17.5% |
| Immigrants | Western Europe | 52.2 /100 | #172 | Average 17.6% |
| Chileans | 50.8 /100 | #173 | Average 17.6% |
| Osage | 50.0 /100 | #174 | Average 17.6% |
| Immigrants | Sweden | 49.1 /100 | #175 | Average 17.6% |
| Nicaraguans | 48.9 /100 | #176 | Average 17.6% |
| Bermudans | 48.7 /100 | #177 | Average 17.6% |
| Celtics | 48.7 /100 | #178 | Average 17.6% |
Demographics Similar to Nigerians by Unemployment Among Ages 16 to 19 years
In terms of unemployment among ages 16 to 19 years, the demographic groups most similar to Nigerians are Spanish American Indian (18.9%, a difference of 0.040%), Immigrants from Central America (18.9%, a difference of 0.080%), Salvadoran (18.9%, a difference of 0.080%), Immigrants from Mexico (18.9%, a difference of 0.16%), and Cree (19.0%, a difference of 0.22%).
| Demographics | Rating | Rank | Unemployment Among Ages 16 to 19 years |
| Central Americans | 0.3 /100 | #253 | Tragic 18.8% |
| Apache | 0.3 /100 | #254 | Tragic 18.8% |
| Immigrants | Cameroon | 0.3 /100 | #255 | Tragic 18.8% |
| Mexican American Indians | 0.3 /100 | #256 | Tragic 18.8% |
| Immigrants | Nigeria | 0.2 /100 | #257 | Tragic 18.9% |
| Immigrants | Mexico | 0.2 /100 | #258 | Tragic 18.9% |
| Immigrants | Central America | 0.2 /100 | #259 | Tragic 18.9% |
| Nigerians | 0.2 /100 | #260 | Tragic 18.9% |
| Spanish American Indians | 0.1 /100 | #261 | Tragic 18.9% |
| Salvadorans | 0.1 /100 | #262 | Tragic 18.9% |
| Cree | 0.1 /100 | #263 | Tragic 19.0% |
| Yaqui | 0.1 /100 | #264 | Tragic 19.0% |
| Choctaw | 0.1 /100 | #265 | Tragic 19.0% |
| Immigrants | Honduras | 0.1 /100 | #266 | Tragic 19.0% |
| Israelis | 0.1 /100 | #267 | Tragic 19.0% |