Shoshone vs Nigerian Unemployment Among Ages 16 to 19 years
COMPARE
Shoshone
Nigerian
Unemployment Among Ages 16 to 19 years
Unemployment Among Ages 16 to 19 years Comparison
Shoshone
Nigerians
19.3%
UNEMPLOYMENT AMONG AGES 16 TO 19 YEARS
0.0/ 100
METRIC RATING
274th/ 347
METRIC RANK
18.9%
UNEMPLOYMENT AMONG AGES 16 TO 19 YEARS
0.2/ 100
METRIC RATING
260th/ 347
METRIC RANK
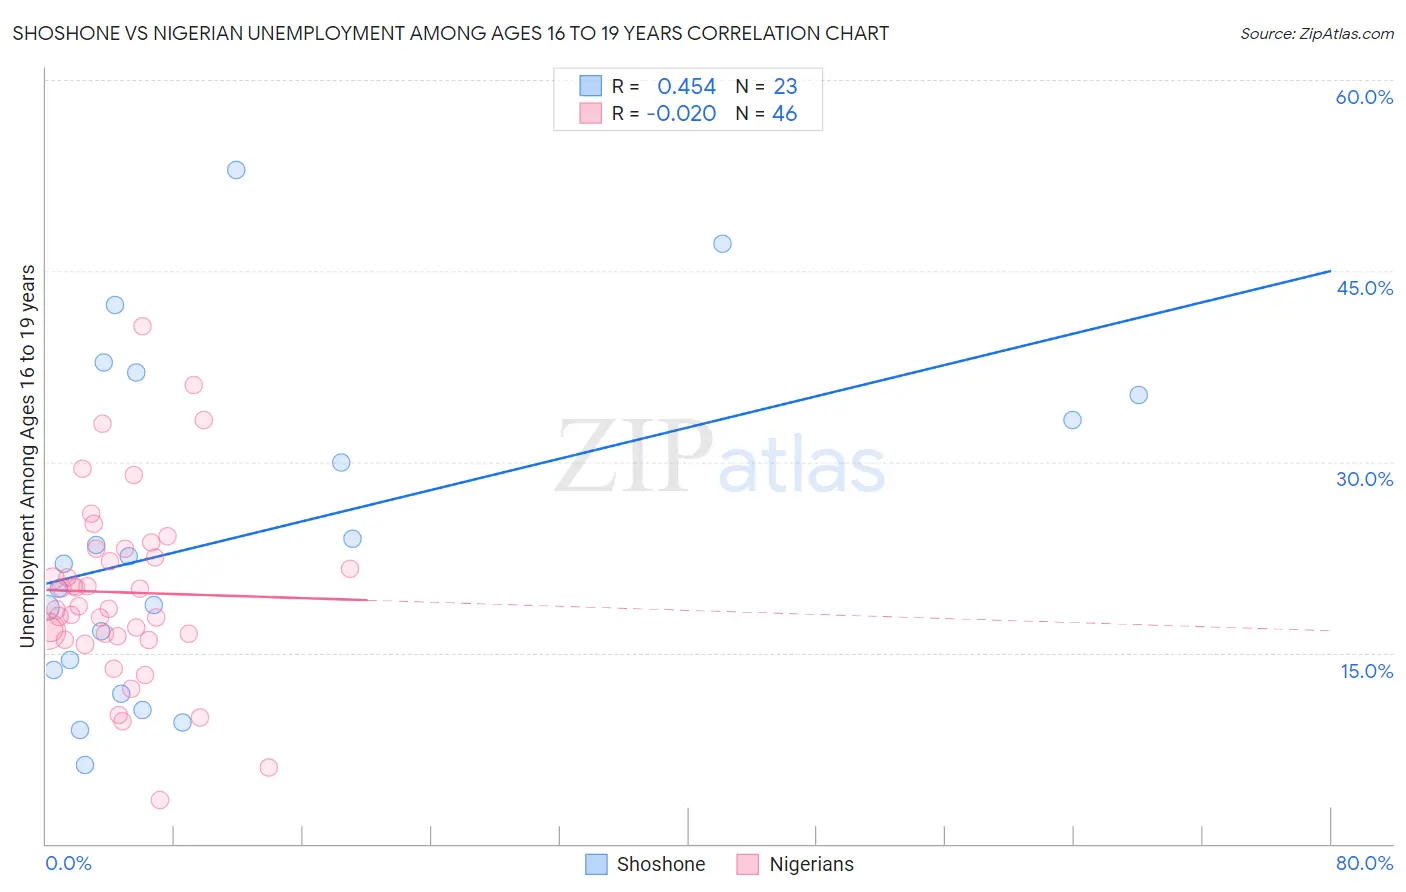
Shoshone vs Nigerian Unemployment Among Ages 16 to 19 years Correlation Chart
The statistical analysis conducted on geographies consisting of 65,748,510 people shows a moderate positive correlation between the proportion of Shoshone and unemployment rate among population between the ages 16 and 19 in the United States with a correlation coefficient (R) of 0.454 and weighted average of 19.3%. Similarly, the statistical analysis conducted on geographies consisting of 322,180,468 people shows no correlation between the proportion of Nigerians and unemployment rate among population between the ages 16 and 19 in the United States with a correlation coefficient (R) of -0.020 and weighted average of 18.9%, a difference of 2.0%.
Unemployment Among Ages 16 to 19 years Correlation Summary
| Measurement | Shoshone | Nigerian |
| Minimum | 6.2% | 3.4% |
| Maximum | 52.9% | 40.6% |
| Range | 46.7% | 37.2% |
| Mean | 24.2% | 19.7% |
| Median | 22.0% | 18.5% |
| Interquartile 25% (IQ1) | 13.6% | 16.3% |
| Interquartile 75% (IQ3) | 35.3% | 23.1% |
| Interquartile Range (IQR) | 21.7% | 6.8% |
| Standard Deviation (Sample) | 13.0% | 7.3% |
| Standard Deviation (Population) | 12.7% | 7.2% |
Demographics Similar to Shoshone and Nigerians by Unemployment Among Ages 16 to 19 years
In terms of unemployment among ages 16 to 19 years, the demographic groups most similar to Shoshone are Immigrants from Panama (19.3%, a difference of 0.15%), Hispanic or Latino (19.2%, a difference of 0.28%), Paraguayan (19.4%, a difference of 0.33%), Blackfeet (19.2%, a difference of 0.40%), and Immigrants from Latin America (19.4%, a difference of 0.42%). Similarly, the demographic groups most similar to Nigerians are Spanish American Indian (18.9%, a difference of 0.040%), Immigrants from Central America (18.9%, a difference of 0.080%), Salvadoran (18.9%, a difference of 0.080%), Immigrants from Mexico (18.9%, a difference of 0.16%), and Cree (19.0%, a difference of 0.22%).
| Demographics | Rating | Rank | Unemployment Among Ages 16 to 19 years |
| Immigrants | Nigeria | 0.2 /100 | #257 | Tragic 18.9% |
| Immigrants | Mexico | 0.2 /100 | #258 | Tragic 18.9% |
| Immigrants | Central America | 0.2 /100 | #259 | Tragic 18.9% |
| Nigerians | 0.2 /100 | #260 | Tragic 18.9% |
| Spanish American Indians | 0.1 /100 | #261 | Tragic 18.9% |
| Salvadorans | 0.1 /100 | #262 | Tragic 18.9% |
| Cree | 0.1 /100 | #263 | Tragic 19.0% |
| Yaqui | 0.1 /100 | #264 | Tragic 19.0% |
| Choctaw | 0.1 /100 | #265 | Tragic 19.0% |
| Immigrants | Honduras | 0.1 /100 | #266 | Tragic 19.0% |
| Israelis | 0.1 /100 | #267 | Tragic 19.0% |
| Immigrants | El Salvador | 0.1 /100 | #268 | Tragic 19.1% |
| Lumbee | 0.1 /100 | #269 | Tragic 19.1% |
| Hondurans | 0.1 /100 | #270 | Tragic 19.2% |
| Blackfeet | 0.0 /100 | #271 | Tragic 19.2% |
| Hispanics or Latinos | 0.0 /100 | #272 | Tragic 19.2% |
| Immigrants | Panama | 0.0 /100 | #273 | Tragic 19.3% |
| Shoshone | 0.0 /100 | #274 | Tragic 19.3% |
| Paraguayans | 0.0 /100 | #275 | Tragic 19.4% |
| Immigrants | Latin America | 0.0 /100 | #276 | Tragic 19.4% |
| Immigrants | Western Africa | 0.0 /100 | #277 | Tragic 19.4% |