Immigrants from Caribbean vs Hawaiian In Labor Force | Age 45-54
COMPARE
Immigrants from Caribbean
Hawaiian
In Labor Force | Age 45-54
In Labor Force | Age 45-54 Comparison
Immigrants from Caribbean
Hawaiians
82.1%
IN LABOR FORCE | AGE 45-54
2.5/ 100
METRIC RATING
226th/ 347
METRIC RANK
81.5%
IN LABOR FORCE | AGE 45-54
0.1/ 100
METRIC RATING
261st/ 347
METRIC RANK
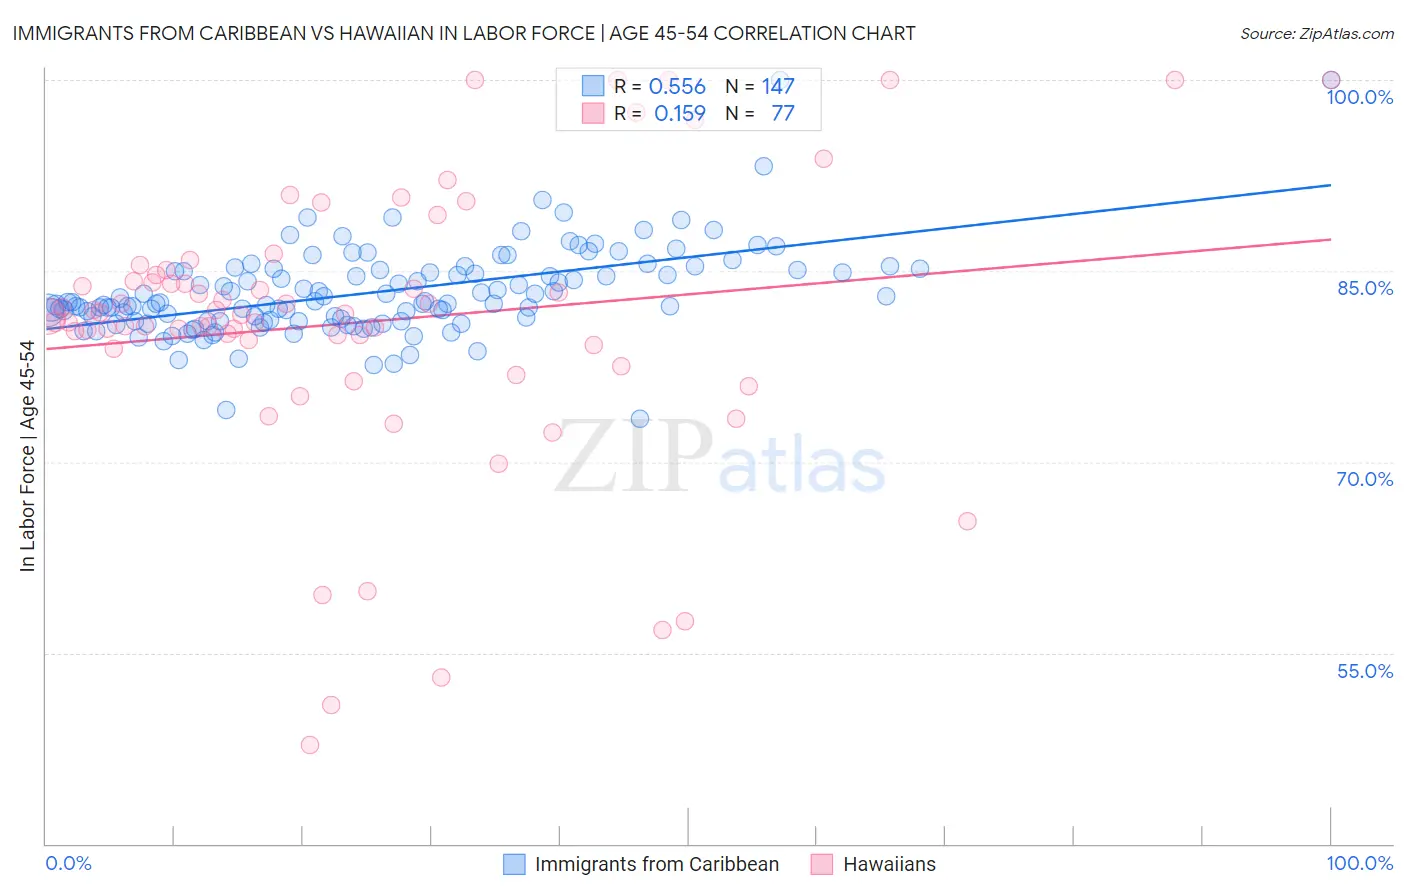
Immigrants from Caribbean vs Hawaiian In Labor Force | Age 45-54 Correlation Chart
The statistical analysis conducted on geographies consisting of 449,588,789 people shows a substantial positive correlation between the proportion of Immigrants from Caribbean and labor force participation rate among population between the ages 45 and 54 in the United States with a correlation coefficient (R) of 0.556 and weighted average of 82.1%. Similarly, the statistical analysis conducted on geographies consisting of 327,376,409 people shows a poor positive correlation between the proportion of Hawaiians and labor force participation rate among population between the ages 45 and 54 in the United States with a correlation coefficient (R) of 0.159 and weighted average of 81.5%, a difference of 0.73%.
In Labor Force | Age 45-54 Correlation Summary
| Measurement | Immigrants from Caribbean | Hawaiian |
| Minimum | 73.4% | 47.8% |
| Maximum | 100.0% | 100.0% |
| Range | 26.6% | 52.2% |
| Mean | 83.3% | 81.0% |
| Median | 82.5% | 81.6% |
| Interquartile 25% (IQ1) | 81.1% | 79.1% |
| Interquartile 75% (IQ3) | 85.1% | 84.8% |
| Interquartile Range (IQR) | 4.0% | 5.8% |
| Standard Deviation (Sample) | 3.6% | 11.0% |
| Standard Deviation (Population) | 3.5% | 10.9% |
Similar Demographics by In Labor Force | Age 45-54
Demographics Similar to Immigrants from Caribbean by In Labor Force | Age 45-54
In terms of in labor force | age 45-54, the demographic groups most similar to Immigrants from Caribbean are Immigrants from Oceania (82.1%, a difference of 0.0%), Immigrants from Germany (82.1%, a difference of 0.010%), Immigrants from Jamaica (82.1%, a difference of 0.020%), Cape Verdean (82.1%, a difference of 0.040%), and Immigrants (82.1%, a difference of 0.050%).
| Demographics | Rating | Rank | In Labor Force | Age 45-54 |
| French | 4.1 /100 | #219 | Tragic 82.2% |
| Bahamians | 3.6 /100 | #220 | Tragic 82.2% |
| Panamanians | 3.5 /100 | #221 | Tragic 82.2% |
| Immigrants | Ecuador | 3.4 /100 | #222 | Tragic 82.2% |
| Immigrants | Immigrants | 3.1 /100 | #223 | Tragic 82.1% |
| Immigrants | Jamaica | 2.7 /100 | #224 | Tragic 82.1% |
| Immigrants | Oceania | 2.5 /100 | #225 | Tragic 82.1% |
| Immigrants | Caribbean | 2.5 /100 | #226 | Tragic 82.1% |
| Immigrants | Germany | 2.4 /100 | #227 | Tragic 82.1% |
| Cape Verdeans | 2.1 /100 | #228 | Tragic 82.1% |
| Immigrants | Burma/Myanmar | 1.9 /100 | #229 | Tragic 82.0% |
| Jamaicans | 1.8 /100 | #230 | Tragic 82.0% |
| Immigrants | Senegal | 1.7 /100 | #231 | Tragic 82.0% |
| Immigrants | Portugal | 1.7 /100 | #232 | Tragic 82.0% |
| Malaysians | 1.7 /100 | #233 | Tragic 82.0% |
Demographics Similar to Hawaiians by In Labor Force | Age 45-54
In terms of in labor force | age 45-54, the demographic groups most similar to Hawaiians are Immigrants from Guyana (81.5%, a difference of 0.0%), Indonesian (81.5%, a difference of 0.010%), Spaniard (81.5%, a difference of 0.020%), Immigrants from West Indies (81.5%, a difference of 0.020%), and Guyanese (81.5%, a difference of 0.040%).
| Demographics | Rating | Rank | In Labor Force | Age 45-54 |
| Immigrants | Laos | 0.2 /100 | #254 | Tragic 81.6% |
| Scotch-Irish | 0.2 /100 | #255 | Tragic 81.6% |
| Barbadians | 0.1 /100 | #256 | Tragic 81.6% |
| Immigrants | Congo | 0.1 /100 | #257 | Tragic 81.6% |
| Immigrants | Fiji | 0.1 /100 | #258 | Tragic 81.5% |
| Guyanese | 0.1 /100 | #259 | Tragic 81.5% |
| Spaniards | 0.1 /100 | #260 | Tragic 81.5% |
| Hawaiians | 0.1 /100 | #261 | Tragic 81.5% |
| Immigrants | Guyana | 0.1 /100 | #262 | Tragic 81.5% |
| Indonesians | 0.1 /100 | #263 | Tragic 81.5% |
| Immigrants | West Indies | 0.1 /100 | #264 | Tragic 81.5% |
| Hondurans | 0.1 /100 | #265 | Tragic 81.4% |
| Immigrants | St. Vincent and the Grenadines | 0.1 /100 | #266 | Tragic 81.4% |
| West Indians | 0.1 /100 | #267 | Tragic 81.4% |
| Immigrants | Honduras | 0.0 /100 | #268 | Tragic 81.4% |