Immigrants from Caribbean vs Cree Unemployment Among Women with Children Under 6 years
COMPARE
Immigrants from Caribbean
Cree
Unemployment Among Women with Children Under 6 years
Unemployment Among Women with Children Under 6 years Comparison
Immigrants from Caribbean
Cree
8.3%
UNEMPLOYMENT AMONG WOMEN WITH CHILDREN UNDER 6 YEARS
0.7/ 100
METRIC RATING
254th/ 347
METRIC RANK
7.6%
UNEMPLOYMENT AMONG WOMEN WITH CHILDREN UNDER 6 YEARS
51.6/ 100
METRIC RATING
173rd/ 347
METRIC RANK
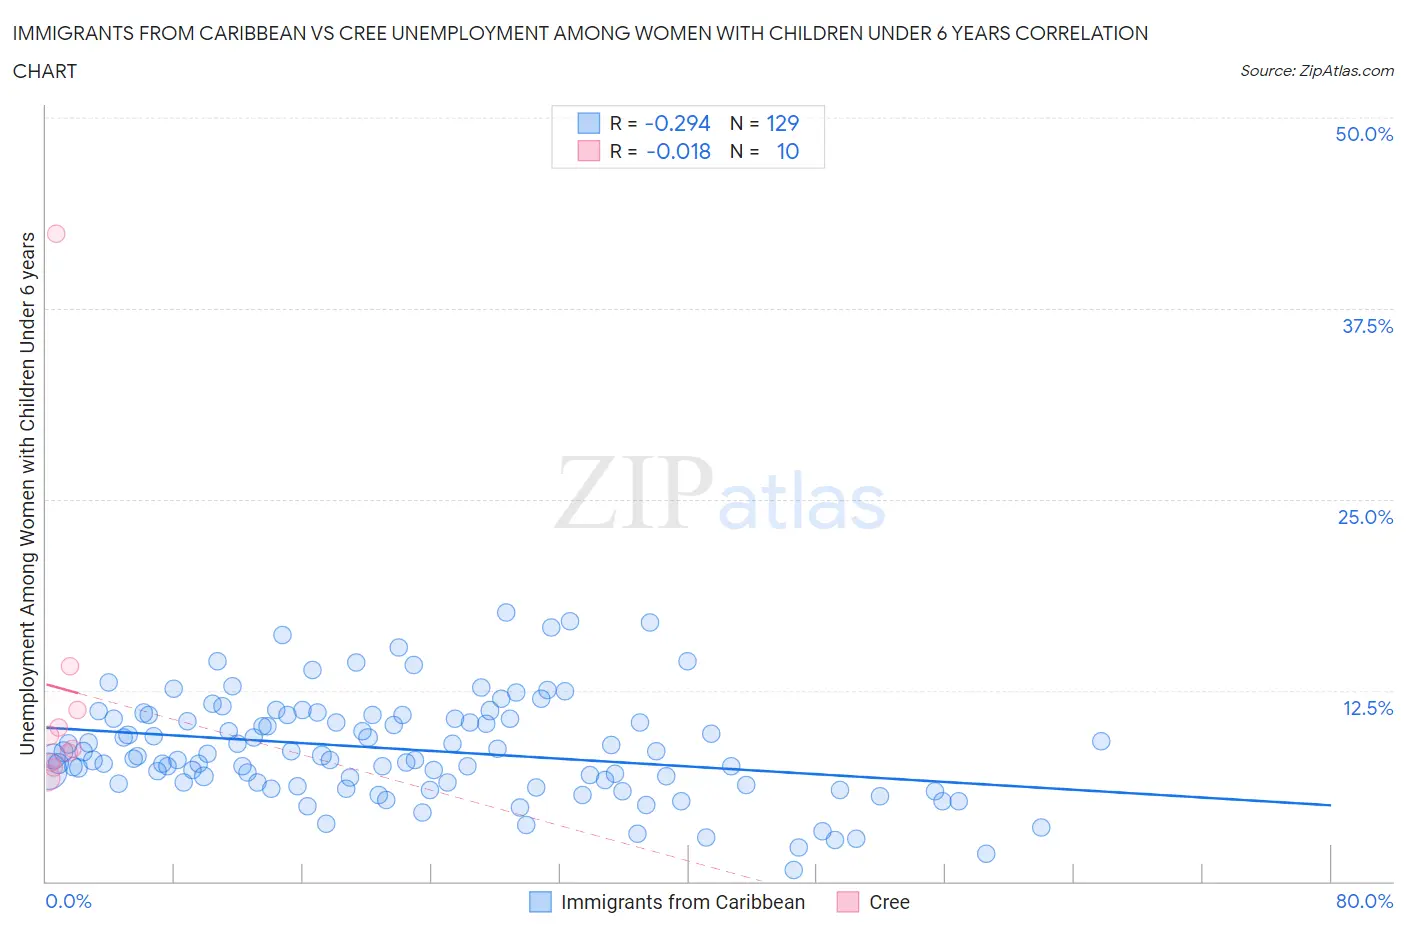
Immigrants from Caribbean vs Cree Unemployment Among Women with Children Under 6 years Correlation Chart
The statistical analysis conducted on geographies consisting of 333,938,519 people shows a weak negative correlation between the proportion of Immigrants from Caribbean and unemployment rate among women with children under the age of 6 in the United States with a correlation coefficient (R) of -0.294 and weighted average of 8.3%. Similarly, the statistical analysis conducted on geographies consisting of 69,437,717 people shows no correlation between the proportion of Cree and unemployment rate among women with children under the age of 6 in the United States with a correlation coefficient (R) of -0.018 and weighted average of 7.6%, a difference of 8.3%.
Unemployment Among Women with Children Under 6 years Correlation Summary
| Measurement | Immigrants from Caribbean | Cree |
| Minimum | 0.70% | 6.8% |
| Maximum | 17.6% | 42.4% |
| Range | 16.9% | 35.6% |
| Mean | 8.6% | 12.6% |
| Median | 8.2% | 9.1% |
| Interquartile 25% (IQ1) | 6.4% | 7.8% |
| Interquartile 75% (IQ3) | 10.7% | 11.2% |
| Interquartile Range (IQR) | 4.3% | 3.4% |
| Standard Deviation (Sample) | 3.3% | 10.7% |
| Standard Deviation (Population) | 3.3% | 10.1% |
Similar Demographics by Unemployment Among Women with Children Under 6 years
Demographics Similar to Immigrants from Caribbean by Unemployment Among Women with Children Under 6 years
In terms of unemployment among women with children under 6 years, the demographic groups most similar to Immigrants from Caribbean are Immigrants from Guyana (8.2%, a difference of 0.27%), Immigrants from Portugal (8.3%, a difference of 0.29%), Celtic (8.3%, a difference of 0.31%), Guyanese (8.2%, a difference of 0.44%), and Ghanaian (8.2%, a difference of 0.44%).
| Demographics | Rating | Rank | Unemployment Among Women with Children Under 6 years |
| German Russians | 1.2 /100 | #247 | Tragic 8.2% |
| Immigrants | Western Africa | 1.1 /100 | #248 | Tragic 8.2% |
| Immigrants | Sierra Leone | 1.1 /100 | #249 | Tragic 8.2% |
| Nigerians | 1.1 /100 | #250 | Tragic 8.2% |
| Guyanese | 1.0 /100 | #251 | Tragic 8.2% |
| Ghanaians | 1.0 /100 | #252 | Tragic 8.2% |
| Immigrants | Guyana | 0.8 /100 | #253 | Tragic 8.2% |
| Immigrants | Caribbean | 0.7 /100 | #254 | Tragic 8.3% |
| Immigrants | Portugal | 0.6 /100 | #255 | Tragic 8.3% |
| Celtics | 0.6 /100 | #256 | Tragic 8.3% |
| British West Indians | 0.5 /100 | #257 | Tragic 8.3% |
| Immigrants | Ghana | 0.5 /100 | #258 | Tragic 8.3% |
| Barbadians | 0.4 /100 | #259 | Tragic 8.3% |
| Whites/Caucasians | 0.3 /100 | #260 | Tragic 8.4% |
| Immigrants | Liberia | 0.3 /100 | #261 | Tragic 8.4% |
Demographics Similar to Cree by Unemployment Among Women with Children Under 6 years
In terms of unemployment among women with children under 6 years, the demographic groups most similar to Cree are Immigrants from Laos (7.6%, a difference of 0.11%), Panamanian (7.6%, a difference of 0.13%), Puget Sound Salish (7.7%, a difference of 0.26%), Austrian (7.7%, a difference of 0.37%), and Immigrants from North America (7.6%, a difference of 0.41%).
| Demographics | Rating | Rank | Unemployment Among Women with Children Under 6 years |
| Belgians | 63.5 /100 | #166 | Good 7.6% |
| Kenyans | 62.5 /100 | #167 | Good 7.6% |
| Immigrants | Canada | 61.6 /100 | #168 | Good 7.6% |
| Immigrants | Scotland | 61.3 /100 | #169 | Good 7.6% |
| Czechs | 59.8 /100 | #170 | Average 7.6% |
| Immigrants | Grenada | 59.0 /100 | #171 | Average 7.6% |
| Immigrants | North America | 57.7 /100 | #172 | Average 7.6% |
| Cree | 51.6 /100 | #173 | Average 7.6% |
| Immigrants | Laos | 50.0 /100 | #174 | Average 7.6% |
| Panamanians | 49.6 /100 | #175 | Average 7.6% |
| Puget Sound Salish | 47.7 /100 | #176 | Average 7.7% |
| Austrians | 46.0 /100 | #177 | Average 7.7% |
| Immigrants | England | 45.4 /100 | #178 | Average 7.7% |
| Immigrants | Western Europe | 44.9 /100 | #179 | Average 7.7% |
| Immigrants | Uruguay | 44.5 /100 | #180 | Average 7.7% |