Cherokee vs Indian (Asian) Unemployment Among Ages 35 to 44 years
COMPARE
Cherokee
Indian (Asian)
Unemployment Among Ages 35 to 44 years
Unemployment Among Ages 35 to 44 years Comparison
Cherokee
Indians (Asian)
5.2%
UNEMPLOYMENT AMONG AGES 35 TO 44 YEARS
0.2/ 100
METRIC RATING
255th/ 347
METRIC RANK
4.4%
UNEMPLOYMENT AMONG AGES 35 TO 44 YEARS
96.0/ 100
METRIC RATING
78th/ 347
METRIC RANK
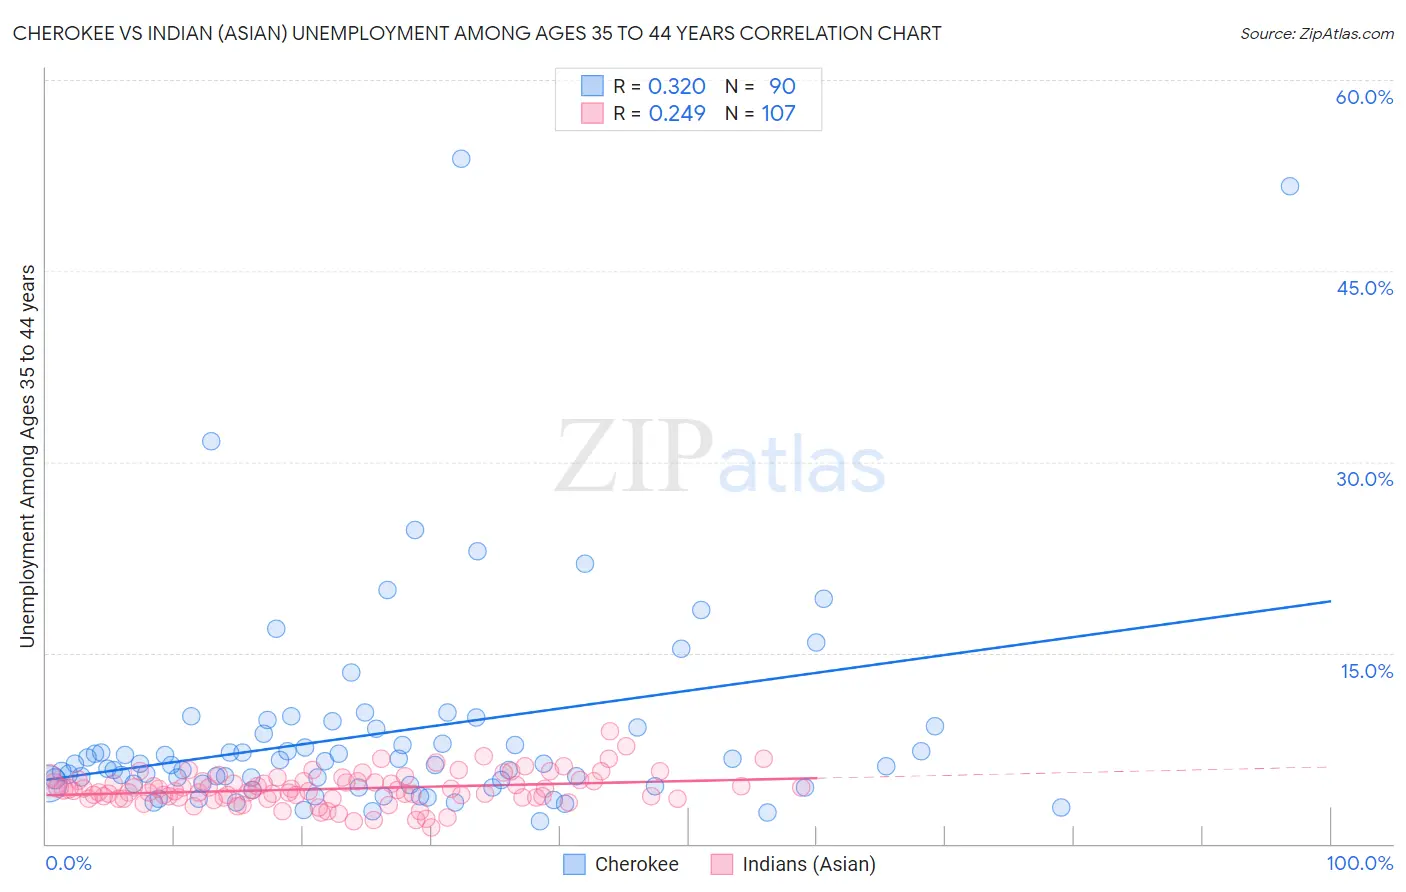
Cherokee vs Indian (Asian) Unemployment Among Ages 35 to 44 years Correlation Chart
The statistical analysis conducted on geographies consisting of 472,158,957 people shows a mild positive correlation between the proportion of Cherokee and unemployment rate among population between the ages 35 and 44 in the United States with a correlation coefficient (R) of 0.320 and weighted average of 5.2%. Similarly, the statistical analysis conducted on geographies consisting of 477,470,317 people shows a weak positive correlation between the proportion of Indians (Asian) and unemployment rate among population between the ages 35 and 44 in the United States with a correlation coefficient (R) of 0.249 and weighted average of 4.4%, a difference of 18.1%.
Unemployment Among Ages 35 to 44 years Correlation Summary
| Measurement | Cherokee | Indian (Asian) |
| Minimum | 1.8% | 1.3% |
| Maximum | 53.8% | 8.8% |
| Range | 52.0% | 7.5% |
| Mean | 8.7% | 4.3% |
| Median | 6.2% | 4.2% |
| Interquartile 25% (IQ1) | 4.7% | 3.6% |
| Interquartile 75% (IQ3) | 9.0% | 5.0% |
| Interquartile Range (IQR) | 4.3% | 1.3% |
| Standard Deviation (Sample) | 8.5% | 1.3% |
| Standard Deviation (Population) | 8.5% | 1.3% |
Similar Demographics by Unemployment Among Ages 35 to 44 years
Demographics Similar to Cherokee by Unemployment Among Ages 35 to 44 years
In terms of unemployment among ages 35 to 44 years, the demographic groups most similar to Cherokee are Immigrants from Bahamas (5.2%, a difference of 0.050%), Mexican American Indian (5.2%, a difference of 0.080%), Armenian (5.2%, a difference of 0.10%), Comanche (5.2%, a difference of 0.23%), and Seminole (5.2%, a difference of 0.25%).
| Demographics | Rating | Rank | Unemployment Among Ages 35 to 44 years |
| Alsatians | 0.2 /100 | #248 | Tragic 5.2% |
| Immigrants | Liberia | 0.2 /100 | #249 | Tragic 5.2% |
| Immigrants | El Salvador | 0.2 /100 | #250 | Tragic 5.2% |
| Comanche | 0.2 /100 | #251 | Tragic 5.2% |
| Armenians | 0.2 /100 | #252 | Tragic 5.2% |
| Mexican American Indians | 0.2 /100 | #253 | Tragic 5.2% |
| Immigrants | Bahamas | 0.2 /100 | #254 | Tragic 5.2% |
| Cherokee | 0.2 /100 | #255 | Tragic 5.2% |
| Seminole | 0.1 /100 | #256 | Tragic 5.2% |
| Immigrants | Fiji | 0.1 /100 | #257 | Tragic 5.3% |
| Immigrants | Latin America | 0.1 /100 | #258 | Tragic 5.3% |
| Mexicans | 0.1 /100 | #259 | Tragic 5.3% |
| Sub-Saharan Africans | 0.1 /100 | #260 | Tragic 5.3% |
| Spanish Americans | 0.1 /100 | #261 | Tragic 5.3% |
| Immigrants | Central America | 0.1 /100 | #262 | Tragic 5.3% |
Demographics Similar to Indians (Asian) by Unemployment Among Ages 35 to 44 years
In terms of unemployment among ages 35 to 44 years, the demographic groups most similar to Indians (Asian) are Immigrants from Sweden (4.4%, a difference of 0.050%), Dutch (4.4%, a difference of 0.060%), Kenyan (4.4%, a difference of 0.12%), Immigrants from Jordan (4.4%, a difference of 0.14%), and Immigrants from Scotland (4.4%, a difference of 0.17%).
| Demographics | Rating | Rank | Unemployment Among Ages 35 to 44 years |
| Immigrants | Lithuania | 96.7 /100 | #71 | Exceptional 4.4% |
| Northern Europeans | 96.5 /100 | #72 | Exceptional 4.4% |
| Lithuanians | 96.5 /100 | #73 | Exceptional 4.4% |
| Poles | 96.4 /100 | #74 | Exceptional 4.4% |
| Immigrants | Romania | 96.3 /100 | #75 | Exceptional 4.4% |
| Immigrants | Jordan | 96.3 /100 | #76 | Exceptional 4.4% |
| Dutch | 96.1 /100 | #77 | Exceptional 4.4% |
| Indians (Asian) | 96.0 /100 | #78 | Exceptional 4.4% |
| Immigrants | Sweden | 95.9 /100 | #79 | Exceptional 4.4% |
| Kenyans | 95.7 /100 | #80 | Exceptional 4.4% |
| Immigrants | Scotland | 95.6 /100 | #81 | Exceptional 4.4% |
| Immigrants | Asia | 95.6 /100 | #82 | Exceptional 4.4% |
| Immigrants | Australia | 95.3 /100 | #83 | Exceptional 4.4% |
| Immigrants | Chile | 95.2 /100 | #84 | Exceptional 4.4% |
| Immigrants | Kenya | 95.0 /100 | #85 | Exceptional 4.4% |