Icelander vs Indian (Asian) Unemployment Among Ages 35 to 44 years
COMPARE
Icelander
Indian (Asian)
Unemployment Among Ages 35 to 44 years
Unemployment Among Ages 35 to 44 years Comparison
Icelanders
Indians (Asian)
4.4%
UNEMPLOYMENT AMONG AGES 35 TO 44 YEARS
96.8/ 100
METRIC RATING
66th/ 347
METRIC RANK
4.4%
UNEMPLOYMENT AMONG AGES 35 TO 44 YEARS
96.0/ 100
METRIC RATING
78th/ 347
METRIC RANK
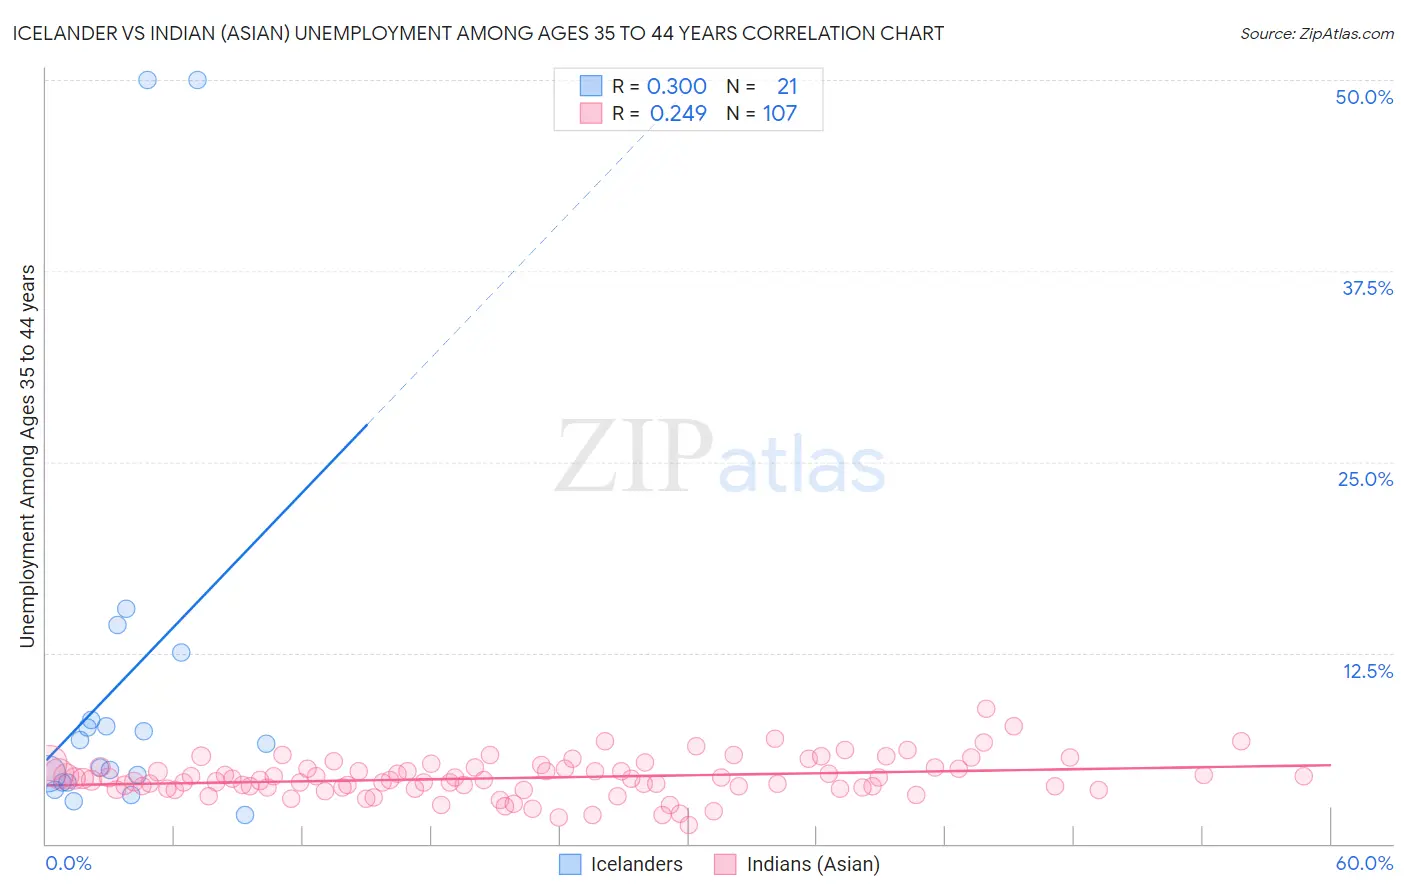
Icelander vs Indian (Asian) Unemployment Among Ages 35 to 44 years Correlation Chart
The statistical analysis conducted on geographies consisting of 157,838,356 people shows a weak positive correlation between the proportion of Icelanders and unemployment rate among population between the ages 35 and 44 in the United States with a correlation coefficient (R) of 0.300 and weighted average of 4.4%. Similarly, the statistical analysis conducted on geographies consisting of 477,470,317 people shows a weak positive correlation between the proportion of Indians (Asian) and unemployment rate among population between the ages 35 and 44 in the United States with a correlation coefficient (R) of 0.249 and weighted average of 4.4%, a difference of 0.46%.
Unemployment Among Ages 35 to 44 years Correlation Summary
| Measurement | Icelander | Indian (Asian) |
| Minimum | 1.9% | 1.3% |
| Maximum | 50.0% | 8.8% |
| Range | 48.1% | 7.5% |
| Mean | 10.7% | 4.3% |
| Median | 6.6% | 4.2% |
| Interquartile 25% (IQ1) | 4.0% | 3.6% |
| Interquartile 75% (IQ3) | 10.3% | 5.0% |
| Interquartile Range (IQR) | 6.3% | 1.3% |
| Standard Deviation (Sample) | 13.6% | 1.3% |
| Standard Deviation (Population) | 13.2% | 1.3% |
Demographics Similar to Icelanders and Indians (Asian) by Unemployment Among Ages 35 to 44 years
In terms of unemployment among ages 35 to 44 years, the demographic groups most similar to Icelanders are Argentinean (4.4%, a difference of 0.0%), Immigrants from Ireland (4.4%, a difference of 0.010%), Cambodian (4.4%, a difference of 0.080%), Slovene (4.4%, a difference of 0.080%), and Immigrants from China (4.4%, a difference of 0.080%). Similarly, the demographic groups most similar to Indians (Asian) are Immigrants from Sweden (4.4%, a difference of 0.050%), Dutch (4.4%, a difference of 0.060%), Kenyan (4.4%, a difference of 0.12%), Immigrants from Jordan (4.4%, a difference of 0.14%), and Immigrants from Scotland (4.4%, a difference of 0.17%).
| Demographics | Rating | Rank | Unemployment Among Ages 35 to 44 years |
| Immigrants | Bulgaria | 97.1 /100 | #62 | Exceptional 4.4% |
| Austrians | 97.1 /100 | #63 | Exceptional 4.4% |
| Immigrants | Serbia | 97.0 /100 | #64 | Exceptional 4.4% |
| Cambodians | 97.0 /100 | #65 | Exceptional 4.4% |
| Icelanders | 96.8 /100 | #66 | Exceptional 4.4% |
| Argentineans | 96.8 /100 | #67 | Exceptional 4.4% |
| Immigrants | Ireland | 96.8 /100 | #68 | Exceptional 4.4% |
| Slovenes | 96.7 /100 | #69 | Exceptional 4.4% |
| Immigrants | China | 96.7 /100 | #70 | Exceptional 4.4% |
| Immigrants | Lithuania | 96.7 /100 | #71 | Exceptional 4.4% |
| Northern Europeans | 96.5 /100 | #72 | Exceptional 4.4% |
| Lithuanians | 96.5 /100 | #73 | Exceptional 4.4% |
| Poles | 96.4 /100 | #74 | Exceptional 4.4% |
| Immigrants | Romania | 96.3 /100 | #75 | Exceptional 4.4% |
| Immigrants | Jordan | 96.3 /100 | #76 | Exceptional 4.4% |
| Dutch | 96.1 /100 | #77 | Exceptional 4.4% |
| Indians (Asian) | 96.0 /100 | #78 | Exceptional 4.4% |
| Immigrants | Sweden | 95.9 /100 | #79 | Exceptional 4.4% |
| Kenyans | 95.7 /100 | #80 | Exceptional 4.4% |
| Immigrants | Scotland | 95.6 /100 | #81 | Exceptional 4.4% |
| Immigrants | Asia | 95.6 /100 | #82 | Exceptional 4.4% |