Syrian vs Immigrants from Middle Africa Unemployment
COMPARE
Syrian
Immigrants from Middle Africa
Unemployment
Unemployment Comparison
Syrians
Immigrants from Middle Africa
5.2%
UNEMPLOYMENT
77.7/ 100
METRIC RATING
149th/ 347
METRIC RANK
5.4%
UNEMPLOYMENT
15.3/ 100
METRIC RATING
213th/ 347
METRIC RANK
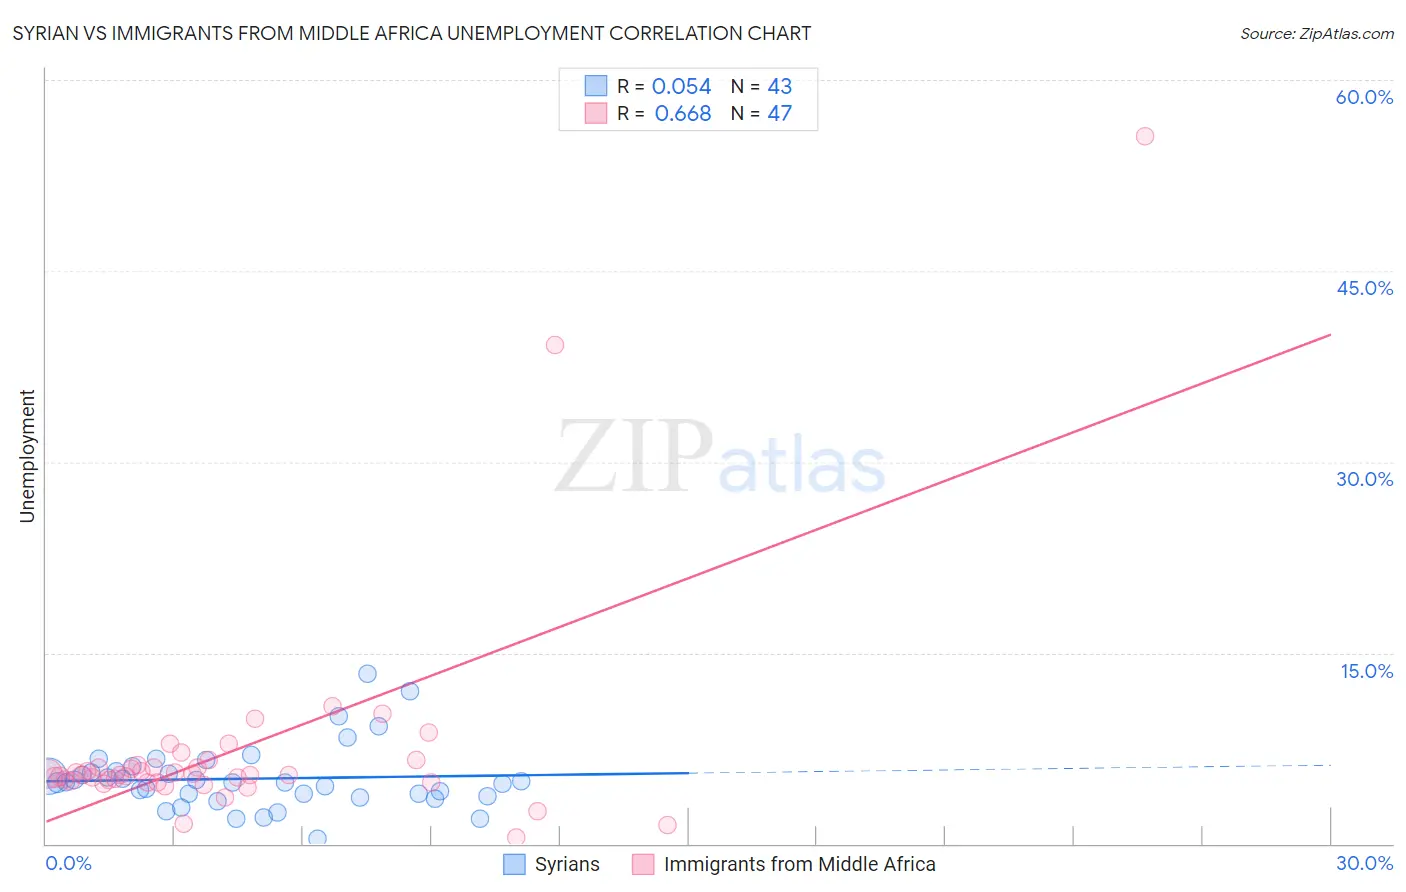
Syrian vs Immigrants from Middle Africa Unemployment Correlation Chart
The statistical analysis conducted on geographies consisting of 266,191,069 people shows a slight positive correlation between the proportion of Syrians and unemployment in the United States with a correlation coefficient (R) of 0.054 and weighted average of 5.2%. Similarly, the statistical analysis conducted on geographies consisting of 202,675,863 people shows a significant positive correlation between the proportion of Immigrants from Middle Africa and unemployment in the United States with a correlation coefficient (R) of 0.668 and weighted average of 5.4%, a difference of 4.6%.
Unemployment Correlation Summary
| Measurement | Syrian | Immigrants from Middle Africa |
| Minimum | 0.40% | 0.50% |
| Maximum | 13.4% | 55.6% |
| Range | 13.0% | 55.1% |
| Mean | 5.1% | 7.3% |
| Median | 4.8% | 5.4% |
| Interquartile 25% (IQ1) | 3.7% | 4.8% |
| Interquartile 75% (IQ3) | 5.7% | 6.1% |
| Interquartile Range (IQR) | 2.0% | 1.3% |
| Standard Deviation (Sample) | 2.5% | 8.9% |
| Standard Deviation (Population) | 2.5% | 8.8% |
Similar Demographics by Unemployment
Demographics Similar to Syrians by Unemployment
In terms of unemployment, the demographic groups most similar to Syrians are Immigrants from Italy (5.1%, a difference of 0.13%), Potawatomi (5.2%, a difference of 0.14%), Immigrants from Eastern Europe (5.2%, a difference of 0.21%), Immigrants from Hong Kong (5.2%, a difference of 0.22%), and Egyptian (5.2%, a difference of 0.22%).
| Demographics | Rating | Rank | Unemployment |
| Immigrants | Pakistan | 83.2 /100 | #142 | Excellent 5.1% |
| Immigrants | Chile | 82.8 /100 | #143 | Excellent 5.1% |
| Indonesians | 82.3 /100 | #144 | Excellent 5.1% |
| Immigrants | Norway | 81.8 /100 | #145 | Excellent 5.1% |
| Immigrants | Asia | 81.8 /100 | #146 | Excellent 5.1% |
| Indians (Asian) | 81.6 /100 | #147 | Excellent 5.1% |
| Immigrants | Italy | 79.1 /100 | #148 | Good 5.1% |
| Syrians | 77.7 /100 | #149 | Good 5.2% |
| Potawatomi | 76.2 /100 | #150 | Good 5.2% |
| Immigrants | Eastern Europe | 75.3 /100 | #151 | Good 5.2% |
| Immigrants | Hong Kong | 75.2 /100 | #152 | Good 5.2% |
| Egyptians | 75.2 /100 | #153 | Good 5.2% |
| Immigrants | China | 74.7 /100 | #154 | Good 5.2% |
| Immigrants | Northern Africa | 71.3 /100 | #155 | Good 5.2% |
| Immigrants | Kazakhstan | 70.4 /100 | #156 | Good 5.2% |
Demographics Similar to Immigrants from Middle Africa by Unemployment
In terms of unemployment, the demographic groups most similar to Immigrants from Middle Africa are Immigrants from Costa Rica (5.4%, a difference of 0.0%), Delaware (5.4%, a difference of 0.060%), Immigrants from South America (5.4%, a difference of 0.22%), Immigrants from Albania (5.4%, a difference of 0.22%), and Ugandan (5.4%, a difference of 0.29%).
| Demographics | Rating | Rank | Unemployment |
| Immigrants | Peru | 22.7 /100 | #206 | Fair 5.4% |
| Creek | 19.4 /100 | #207 | Poor 5.4% |
| Portuguese | 19.0 /100 | #208 | Poor 5.4% |
| Immigrants | Iran | 18.8 /100 | #209 | Poor 5.4% |
| Immigrants | Iraq | 18.6 /100 | #210 | Poor 5.4% |
| Iraqis | 18.1 /100 | #211 | Poor 5.4% |
| Ugandans | 18.0 /100 | #212 | Poor 5.4% |
| Immigrants | Middle Africa | 15.3 /100 | #213 | Poor 5.4% |
| Immigrants | Costa Rica | 15.2 /100 | #214 | Poor 5.4% |
| Delaware | 14.7 /100 | #215 | Poor 5.4% |
| Immigrants | South America | 13.5 /100 | #216 | Poor 5.4% |
| Immigrants | Albania | 13.5 /100 | #217 | Poor 5.4% |
| Choctaw | 12.7 /100 | #218 | Poor 5.4% |
| Bangladeshis | 11.2 /100 | #219 | Poor 5.4% |
| Soviet Union | 10.6 /100 | #220 | Poor 5.4% |