Immigrants from Cambodia vs Alsatian Male Unemployment
COMPARE
Immigrants from Cambodia
Alsatian
Male Unemployment
Male Unemployment Comparison
Immigrants from Cambodia
Alsatians
5.6%
MALE UNEMPLOYMENT
1.8/ 100
METRIC RATING
226th/ 347
METRIC RANK
5.4%
MALE UNEMPLOYMENT
16.7/ 100
METRIC RATING
197th/ 347
METRIC RANK
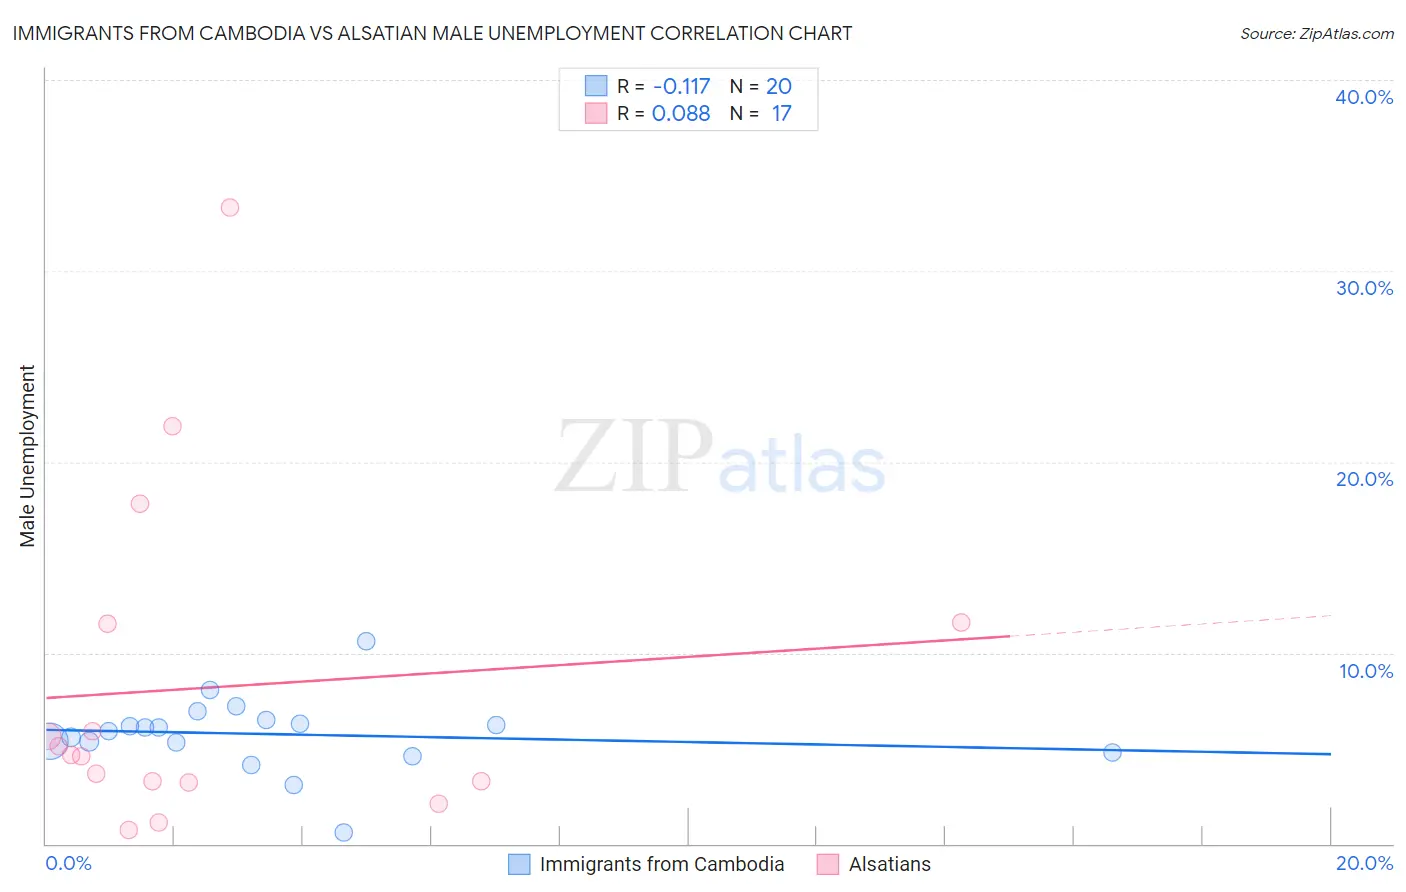
Immigrants from Cambodia vs Alsatian Male Unemployment Correlation Chart
The statistical analysis conducted on geographies consisting of 204,980,262 people shows a poor negative correlation between the proportion of Immigrants from Cambodia and unemployment rate among males in the United States with a correlation coefficient (R) of -0.117 and weighted average of 5.6%. Similarly, the statistical analysis conducted on geographies consisting of 82,581,733 people shows a slight positive correlation between the proportion of Alsatians and unemployment rate among males in the United States with a correlation coefficient (R) of 0.088 and weighted average of 5.4%, a difference of 3.4%.
Male Unemployment Correlation Summary
| Measurement | Immigrants from Cambodia | Alsatian |
| Minimum | 0.60% | 0.70% |
| Maximum | 10.6% | 33.3% |
| Range | 10.0% | 32.6% |
| Mean | 5.7% | 8.2% |
| Median | 6.0% | 4.7% |
| Interquartile 25% (IQ1) | 5.1% | 3.3% |
| Interquartile 75% (IQ3) | 6.4% | 11.6% |
| Interquartile Range (IQR) | 1.3% | 8.3% |
| Standard Deviation (Sample) | 2.0% | 8.7% |
| Standard Deviation (Population) | 1.9% | 8.5% |
Similar Demographics by Male Unemployment
Demographics Similar to Immigrants from Cambodia by Male Unemployment
In terms of male unemployment, the demographic groups most similar to Immigrants from Cambodia are Immigrants from Panama (5.6%, a difference of 0.0%), Seminole (5.6%, a difference of 0.020%), Central American (5.6%, a difference of 0.030%), Immigrants from Africa (5.6%, a difference of 0.060%), and Panamanian (5.6%, a difference of 0.090%).
| Demographics | Rating | Rank | Male Unemployment |
| Immigrants | Western Asia | 3.5 /100 | #219 | Tragic 5.6% |
| Portuguese | 3.5 /100 | #220 | Tragic 5.6% |
| Soviet Union | 3.2 /100 | #221 | Tragic 5.6% |
| Immigrants | Micronesia | 2.9 /100 | #222 | Tragic 5.6% |
| Creek | 2.6 /100 | #223 | Tragic 5.6% |
| Cherokee | 2.4 /100 | #224 | Tragic 5.6% |
| Panamanians | 1.9 /100 | #225 | Tragic 5.6% |
| Immigrants | Cambodia | 1.8 /100 | #226 | Tragic 5.6% |
| Immigrants | Panama | 1.8 /100 | #227 | Tragic 5.6% |
| Seminole | 1.8 /100 | #228 | Tragic 5.6% |
| Central Americans | 1.8 /100 | #229 | Tragic 5.6% |
| Immigrants | Africa | 1.7 /100 | #230 | Tragic 5.6% |
| Choctaw | 1.6 /100 | #231 | Tragic 5.6% |
| Moroccans | 1.6 /100 | #232 | Tragic 5.6% |
| Somalis | 1.5 /100 | #233 | Tragic 5.6% |
Demographics Similar to Alsatians by Male Unemployment
In terms of male unemployment, the demographic groups most similar to Alsatians are Albanian (5.4%, a difference of 0.060%), Immigrants from Southern Europe (5.4%, a difference of 0.10%), Immigrants from Thailand (5.4%, a difference of 0.22%), Immigrants from Greece (5.4%, a difference of 0.24%), and Spanish (5.4%, a difference of 0.28%).
| Demographics | Rating | Rank | Male Unemployment |
| Immigrants | Uganda | 28.8 /100 | #190 | Fair 5.4% |
| Immigrants | South Eastern Asia | 28.2 /100 | #191 | Fair 5.4% |
| Immigrants | Belarus | 26.0 /100 | #192 | Fair 5.4% |
| Immigrants | Israel | 25.2 /100 | #193 | Fair 5.4% |
| Spanish | 19.7 /100 | #194 | Poor 5.4% |
| Immigrants | Southern Europe | 17.7 /100 | #195 | Poor 5.4% |
| Albanians | 17.3 /100 | #196 | Poor 5.4% |
| Alsatians | 16.7 /100 | #197 | Poor 5.4% |
| Immigrants | Thailand | 14.7 /100 | #198 | Poor 5.4% |
| Immigrants | Greece | 14.5 /100 | #199 | Poor 5.4% |
| Immigrants | Zaire | 13.7 /100 | #200 | Poor 5.4% |
| Immigrants | Philippines | 13.5 /100 | #201 | Poor 5.4% |
| Immigrants | Nonimmigrants | 13.1 /100 | #202 | Poor 5.4% |
| Immigrants | Laos | 13.0 /100 | #203 | Poor 5.4% |
| Guamanians/Chamorros | 12.3 /100 | #204 | Poor 5.4% |