Honduran vs Immigrants from Western Africa Unemployment Among Women with Children Under 6 years
COMPARE
Honduran
Immigrants from Western Africa
Unemployment Among Women with Children Under 6 years
Unemployment Among Women with Children Under 6 years Comparison
Hondurans
Immigrants from Western Africa
8.4%
UNEMPLOYMENT AMONG WOMEN WITH CHILDREN UNDER 6 YEARS
0.3/ 100
METRIC RATING
264th/ 347
METRIC RANK
8.2%
UNEMPLOYMENT AMONG WOMEN WITH CHILDREN UNDER 6 YEARS
1.1/ 100
METRIC RATING
248th/ 347
METRIC RANK
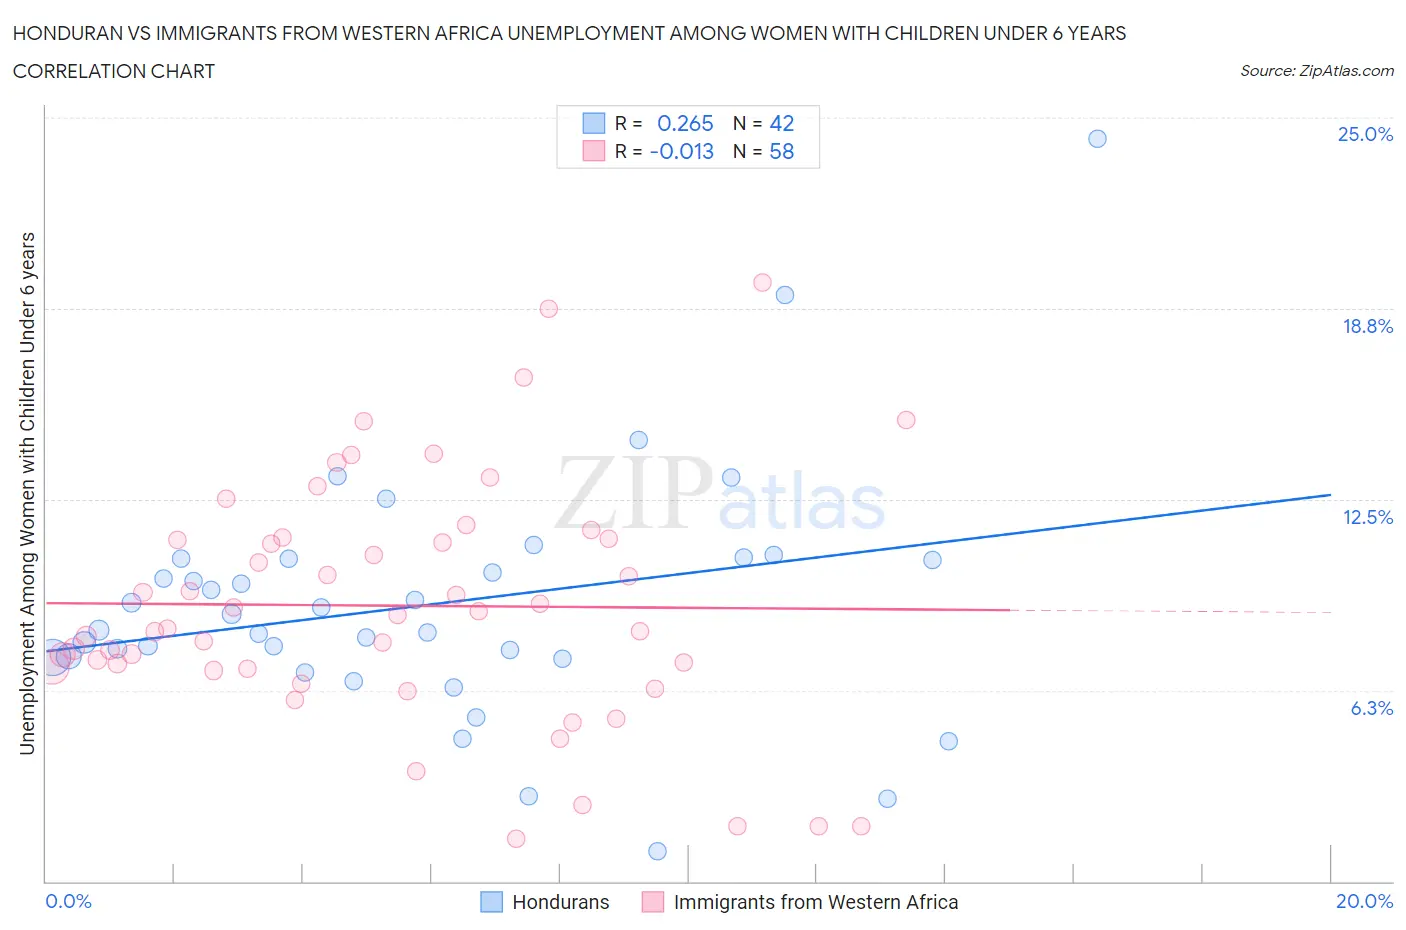
Honduran vs Immigrants from Western Africa Unemployment Among Women with Children Under 6 years Correlation Chart
The statistical analysis conducted on geographies consisting of 285,811,786 people shows a weak positive correlation between the proportion of Hondurans and unemployment rate among women with children under the age of 6 in the United States with a correlation coefficient (R) of 0.265 and weighted average of 8.4%. Similarly, the statistical analysis conducted on geographies consisting of 284,723,749 people shows no correlation between the proportion of Immigrants from Western Africa and unemployment rate among women with children under the age of 6 in the United States with a correlation coefficient (R) of -0.013 and weighted average of 8.2%, a difference of 2.2%.
Unemployment Among Women with Children Under 6 years Correlation Summary
| Measurement | Honduran | Immigrants from Western Africa |
| Minimum | 1.0% | 1.4% |
| Maximum | 24.3% | 19.6% |
| Range | 23.3% | 18.2% |
| Mean | 9.0% | 9.0% |
| Median | 8.5% | 8.5% |
| Interquartile 25% (IQ1) | 7.3% | 7.0% |
| Interquartile 75% (IQ3) | 10.6% | 11.2% |
| Interquartile Range (IQR) | 3.2% | 4.2% |
| Standard Deviation (Sample) | 4.0% | 4.0% |
| Standard Deviation (Population) | 4.0% | 3.9% |
Demographics Similar to Hondurans and Immigrants from Western Africa by Unemployment Among Women with Children Under 6 years
In terms of unemployment among women with children under 6 years, the demographic groups most similar to Hondurans are Scotch-Irish (8.4%, a difference of 0.020%), West Indian (8.4%, a difference of 0.050%), French Canadian (8.4%, a difference of 0.050%), Immigrants from Honduras (8.4%, a difference of 0.050%), and Immigrants from Liberia (8.4%, a difference of 0.060%). Similarly, the demographic groups most similar to Immigrants from Western Africa are German Russian (8.2%, a difference of 0.040%), Immigrants from Sierra Leone (8.2%, a difference of 0.090%), Nigerian (8.2%, a difference of 0.10%), Guyanese (8.2%, a difference of 0.27%), and Ghanaian (8.2%, a difference of 0.27%).
| Demographics | Rating | Rank | Unemployment Among Women with Children Under 6 years |
| Central Americans | 1.4 /100 | #246 | Tragic 8.2% |
| German Russians | 1.2 /100 | #247 | Tragic 8.2% |
| Immigrants | Western Africa | 1.1 /100 | #248 | Tragic 8.2% |
| Immigrants | Sierra Leone | 1.1 /100 | #249 | Tragic 8.2% |
| Nigerians | 1.1 /100 | #250 | Tragic 8.2% |
| Guyanese | 1.0 /100 | #251 | Tragic 8.2% |
| Ghanaians | 1.0 /100 | #252 | Tragic 8.2% |
| Immigrants | Guyana | 0.8 /100 | #253 | Tragic 8.2% |
| Immigrants | Caribbean | 0.7 /100 | #254 | Tragic 8.3% |
| Immigrants | Portugal | 0.6 /100 | #255 | Tragic 8.3% |
| Celtics | 0.6 /100 | #256 | Tragic 8.3% |
| British West Indians | 0.5 /100 | #257 | Tragic 8.3% |
| Immigrants | Ghana | 0.5 /100 | #258 | Tragic 8.3% |
| Barbadians | 0.4 /100 | #259 | Tragic 8.3% |
| Whites/Caucasians | 0.3 /100 | #260 | Tragic 8.4% |
| Immigrants | Liberia | 0.3 /100 | #261 | Tragic 8.4% |
| West Indians | 0.3 /100 | #262 | Tragic 8.4% |
| Scotch-Irish | 0.3 /100 | #263 | Tragic 8.4% |
| Hondurans | 0.3 /100 | #264 | Tragic 8.4% |
| French Canadians | 0.3 /100 | #265 | Tragic 8.4% |
| Immigrants | Honduras | 0.3 /100 | #266 | Tragic 8.4% |