Immigrants from Senegal vs Immigrants from Belize Unemployment Among Ages 25 to 29 years
COMPARE
Immigrants from Senegal
Immigrants from Belize
Unemployment Among Ages 25 to 29 years
Unemployment Among Ages 25 to 29 years Comparison
Immigrants from Senegal
Immigrants from Belize
7.6%
UNEMPLOYMENT AMONG AGES 25 TO 29 YEARS
0.0/ 100
METRIC RATING
282nd/ 347
METRIC RANK
7.8%
UNEMPLOYMENT AMONG AGES 25 TO 29 YEARS
0.0/ 100
METRIC RATING
293rd/ 347
METRIC RANK
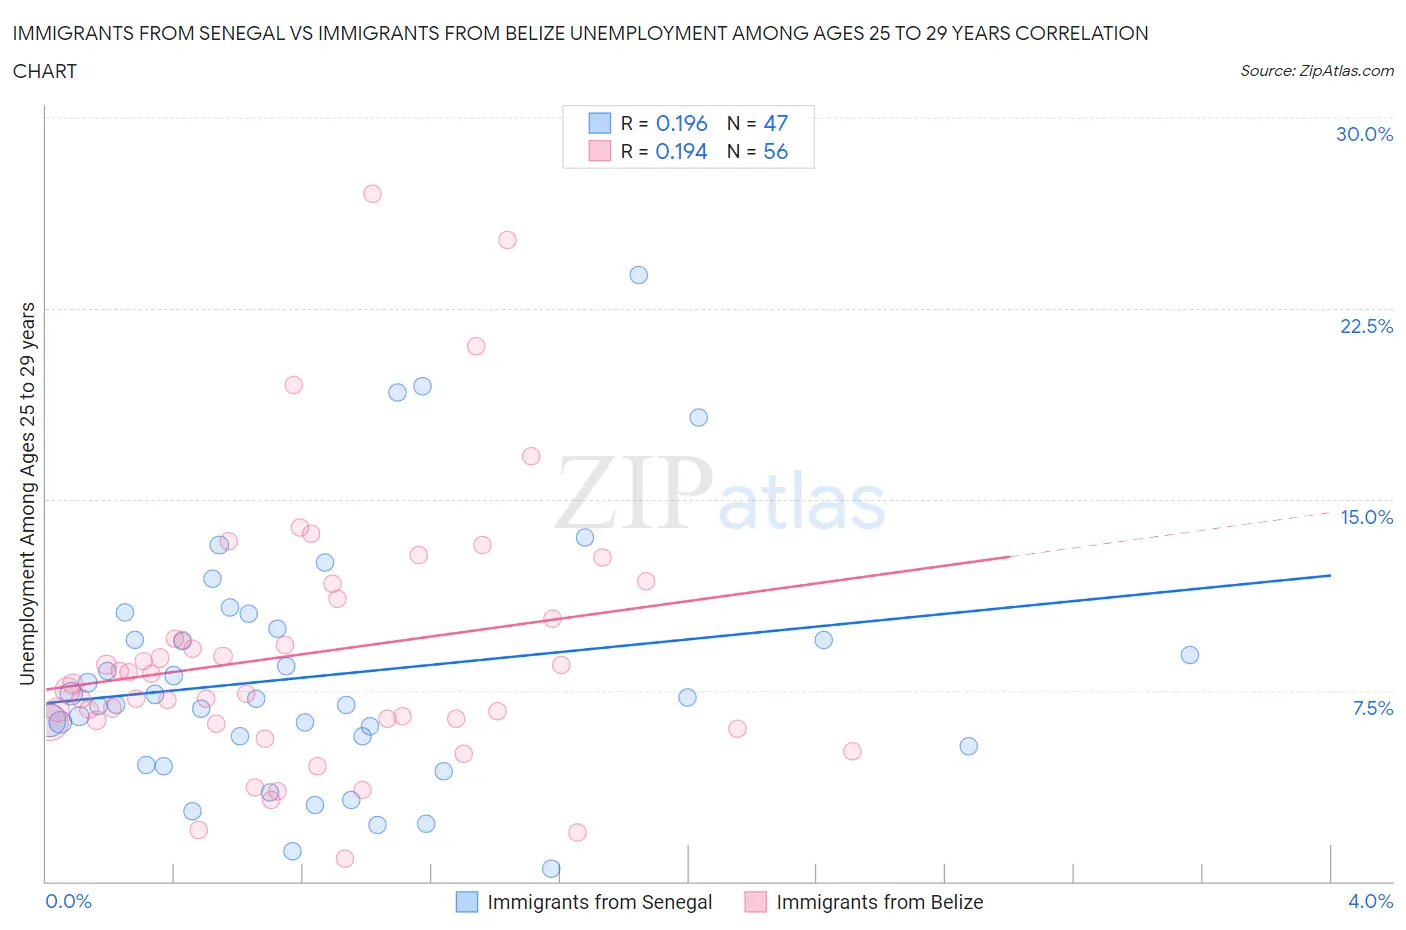
Immigrants from Senegal vs Immigrants from Belize Unemployment Among Ages 25 to 29 years Correlation Chart
The statistical analysis conducted on geographies consisting of 89,401,729 people shows a poor positive correlation between the proportion of Immigrants from Senegal and unemployment rate among population between the ages 25 and 29 in the United States with a correlation coefficient (R) of 0.196 and weighted average of 7.6%. Similarly, the statistical analysis conducted on geographies consisting of 128,941,417 people shows a poor positive correlation between the proportion of Immigrants from Belize and unemployment rate among population between the ages 25 and 29 in the United States with a correlation coefficient (R) of 0.194 and weighted average of 7.8%, a difference of 2.7%.
Unemployment Among Ages 25 to 29 years Correlation Summary
| Measurement | Immigrants from Senegal | Immigrants from Belize |
| Minimum | 0.50% | 0.90% |
| Maximum | 23.8% | 27.0% |
| Range | 23.3% | 26.1% |
| Mean | 8.1% | 8.9% |
| Median | 7.1% | 7.6% |
| Interquartile 25% (IQ1) | 5.3% | 6.3% |
| Interquartile 75% (IQ3) | 9.9% | 10.7% |
| Interquartile Range (IQR) | 4.6% | 4.4% |
| Standard Deviation (Sample) | 4.8% | 5.2% |
| Standard Deviation (Population) | 4.8% | 5.1% |
Demographics Similar to Immigrants from Senegal and Immigrants from Belize by Unemployment Among Ages 25 to 29 years
In terms of unemployment among ages 25 to 29 years, the demographic groups most similar to Immigrants from Senegal are Immigrants from Bangladesh (7.5%, a difference of 0.17%), Creek (7.6%, a difference of 0.17%), Cherokee (7.6%, a difference of 0.18%), Immigrants from Caribbean (7.5%, a difference of 0.26%), and Senegalese (7.6%, a difference of 0.30%). Similarly, the demographic groups most similar to Immigrants from Belize are Chippewa (7.8%, a difference of 0.050%), Trinidadian and Tobagonian (7.8%, a difference of 0.28%), Hispanic or Latino (7.7%, a difference of 0.46%), Comanche (7.8%, a difference of 0.74%), and Armenian (7.7%, a difference of 0.85%).
| Demographics | Rating | Rank | Unemployment Among Ages 25 to 29 years |
| Iroquois | 0.0 /100 | #277 | Tragic 7.5% |
| Mexicans | 0.0 /100 | #278 | Tragic 7.5% |
| Nepalese | 0.0 /100 | #279 | Tragic 7.5% |
| Immigrants | Caribbean | 0.0 /100 | #280 | Tragic 7.5% |
| Immigrants | Bangladesh | 0.0 /100 | #281 | Tragic 7.5% |
| Immigrants | Senegal | 0.0 /100 | #282 | Tragic 7.6% |
| Creek | 0.0 /100 | #283 | Tragic 7.6% |
| Cherokee | 0.0 /100 | #284 | Tragic 7.6% |
| Senegalese | 0.0 /100 | #285 | Tragic 7.6% |
| Vietnamese | 0.0 /100 | #286 | Tragic 7.6% |
| Immigrants | Mexico | 0.0 /100 | #287 | Tragic 7.6% |
| Africans | 0.0 /100 | #288 | Tragic 7.6% |
| Belizeans | 0.0 /100 | #289 | Tragic 7.7% |
| Armenians | 0.0 /100 | #290 | Tragic 7.7% |
| Hispanics or Latinos | 0.0 /100 | #291 | Tragic 7.7% |
| Chippewa | 0.0 /100 | #292 | Tragic 7.8% |
| Immigrants | Belize | 0.0 /100 | #293 | Tragic 7.8% |
| Trinidadians and Tobagonians | 0.0 /100 | #294 | Tragic 7.8% |
| Comanche | 0.0 /100 | #295 | Tragic 7.8% |
| Immigrants | West Indies | 0.0 /100 | #296 | Tragic 7.8% |
| Blackfeet | 0.0 /100 | #297 | Tragic 7.9% |