Immigrants from Israel vs Czech Unemployment Among Ages 60 to 64 years
COMPARE
Immigrants from Israel
Czech
Unemployment Among Ages 60 to 64 years
Unemployment Among Ages 60 to 64 years Comparison
Immigrants from Israel
Czechs
5.3%
UNEMPLOYMENT AMONG AGES 60 TO 64 YEARS
0.0/ 100
METRIC RATING
293rd/ 347
METRIC RANK
4.4%
UNEMPLOYMENT AMONG AGES 60 TO 64 YEARS
100.0/ 100
METRIC RATING
26th/ 347
METRIC RANK
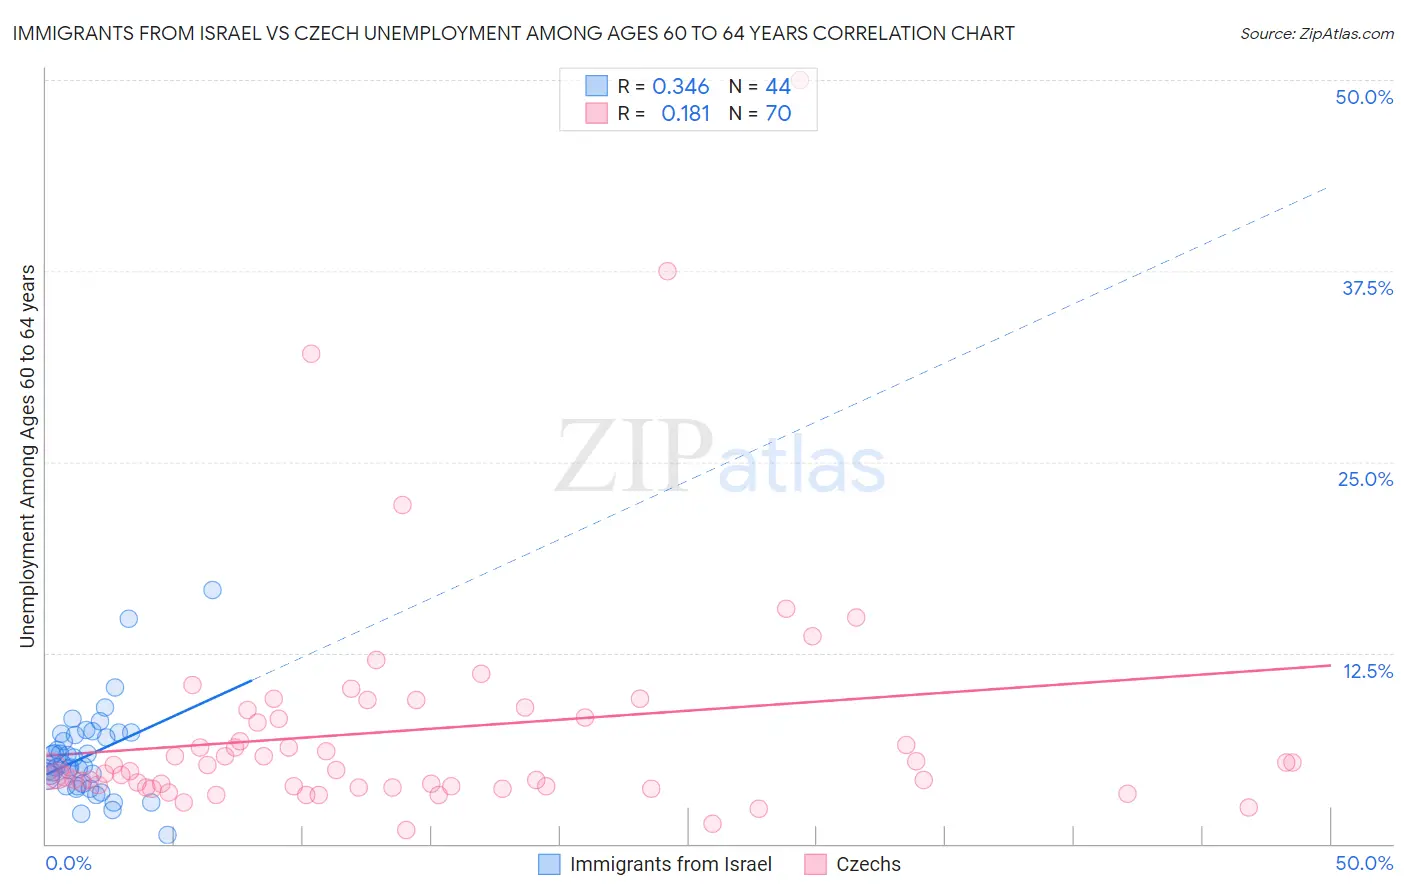
Immigrants from Israel vs Czech Unemployment Among Ages 60 to 64 years Correlation Chart
The statistical analysis conducted on geographies consisting of 200,674,743 people shows a mild positive correlation between the proportion of Immigrants from Israel and unemployment rate among population between the ages 60 and 64 in the United States with a correlation coefficient (R) of 0.346 and weighted average of 5.3%. Similarly, the statistical analysis conducted on geographies consisting of 416,417,760 people shows a poor positive correlation between the proportion of Czechs and unemployment rate among population between the ages 60 and 64 in the United States with a correlation coefficient (R) of 0.181 and weighted average of 4.4%, a difference of 19.4%.
Unemployment Among Ages 60 to 64 years Correlation Summary
| Measurement | Immigrants from Israel | Czech |
| Minimum | 0.60% | 0.87% |
| Maximum | 16.6% | 50.0% |
| Range | 16.0% | 49.1% |
| Mean | 5.8% | 7.5% |
| Median | 5.2% | 4.8% |
| Interquartile 25% (IQ1) | 3.9% | 3.7% |
| Interquartile 75% (IQ3) | 7.2% | 8.3% |
| Interquartile Range (IQR) | 3.3% | 4.6% |
| Standard Deviation (Sample) | 2.9% | 7.9% |
| Standard Deviation (Population) | 2.9% | 7.9% |
Similar Demographics by Unemployment Among Ages 60 to 64 years
Demographics Similar to Immigrants from Israel by Unemployment Among Ages 60 to 64 years
In terms of unemployment among ages 60 to 64 years, the demographic groups most similar to Immigrants from Israel are Immigrants from Latin America (5.3%, a difference of 0.020%), Hispanic or Latino (5.3%, a difference of 0.040%), Black/African American (5.3%, a difference of 0.11%), Armenian (5.3%, a difference of 0.14%), and Jamaican (5.3%, a difference of 0.26%).
| Demographics | Rating | Rank | Unemployment Among Ages 60 to 64 years |
| Mexican American Indians | 0.0 /100 | #286 | Tragic 5.3% |
| Salvadorans | 0.0 /100 | #287 | Tragic 5.3% |
| Trinidadians and Tobagonians | 0.0 /100 | #288 | Tragic 5.3% |
| Spanish Americans | 0.0 /100 | #289 | Tragic 5.3% |
| Immigrants | Trinidad and Tobago | 0.0 /100 | #290 | Tragic 5.3% |
| Hispanics or Latinos | 0.0 /100 | #291 | Tragic 5.3% |
| Immigrants | Latin America | 0.0 /100 | #292 | Tragic 5.3% |
| Immigrants | Israel | 0.0 /100 | #293 | Tragic 5.3% |
| Blacks/African Americans | 0.0 /100 | #294 | Tragic 5.3% |
| Armenians | 0.0 /100 | #295 | Tragic 5.3% |
| Jamaicans | 0.0 /100 | #296 | Tragic 5.3% |
| Osage | 0.0 /100 | #297 | Tragic 5.4% |
| Immigrants | Central America | 0.0 /100 | #298 | Tragic 5.4% |
| Immigrants | El Salvador | 0.0 /100 | #299 | Tragic 5.4% |
| Immigrants | Barbados | 0.0 /100 | #300 | Tragic 5.4% |
Demographics Similar to Czechs by Unemployment Among Ages 60 to 64 years
In terms of unemployment among ages 60 to 64 years, the demographic groups most similar to Czechs are Immigrants from Iraq (4.5%, a difference of 0.080%), Yugoslavian (4.4%, a difference of 0.10%), Immigrants from Nepal (4.5%, a difference of 0.16%), Cuban (4.5%, a difference of 0.39%), and Immigrants from Venezuela (4.5%, a difference of 0.41%).
| Demographics | Rating | Rank | Unemployment Among Ages 60 to 64 years |
| Tsimshian | 100.0 /100 | #19 | Exceptional 4.4% |
| Afghans | 100.0 /100 | #20 | Exceptional 4.4% |
| Immigrants | Cabo Verde | 100.0 /100 | #21 | Exceptional 4.4% |
| Cape Verdeans | 100.0 /100 | #22 | Exceptional 4.4% |
| Immigrants | Zaire | 100.0 /100 | #23 | Exceptional 4.4% |
| Immigrants | Burma/Myanmar | 100.0 /100 | #24 | Exceptional 4.4% |
| Yugoslavians | 100.0 /100 | #25 | Exceptional 4.4% |
| Czechs | 100.0 /100 | #26 | Exceptional 4.4% |
| Immigrants | Iraq | 100.0 /100 | #27 | Exceptional 4.5% |
| Immigrants | Nepal | 100.0 /100 | #28 | Exceptional 4.5% |
| Cubans | 100.0 /100 | #29 | Exceptional 4.5% |
| Immigrants | Venezuela | 100.0 /100 | #30 | Exceptional 4.5% |
| Immigrants | Eritrea | 100.0 /100 | #31 | Exceptional 4.5% |
| Zimbabweans | 100.0 /100 | #32 | Exceptional 4.5% |
| Carpatho Rusyns | 100.0 /100 | #33 | Exceptional 4.5% |