Immigrants from Brazil vs Immigrants from Iran Median Household Income
COMPARE
Immigrants from Brazil
Immigrants from Iran
Median Household Income
Median Household Income Comparison
Immigrants from Brazil
Immigrants from Iran
$90,907
MEDIAN HOUSEHOLD INCOME
97.7/ 100
METRIC RATING
105th/ 347
METRIC RANK
$108,055
MEDIAN HOUSEHOLD INCOME
100.0/ 100
METRIC RATING
8th/ 347
METRIC RANK
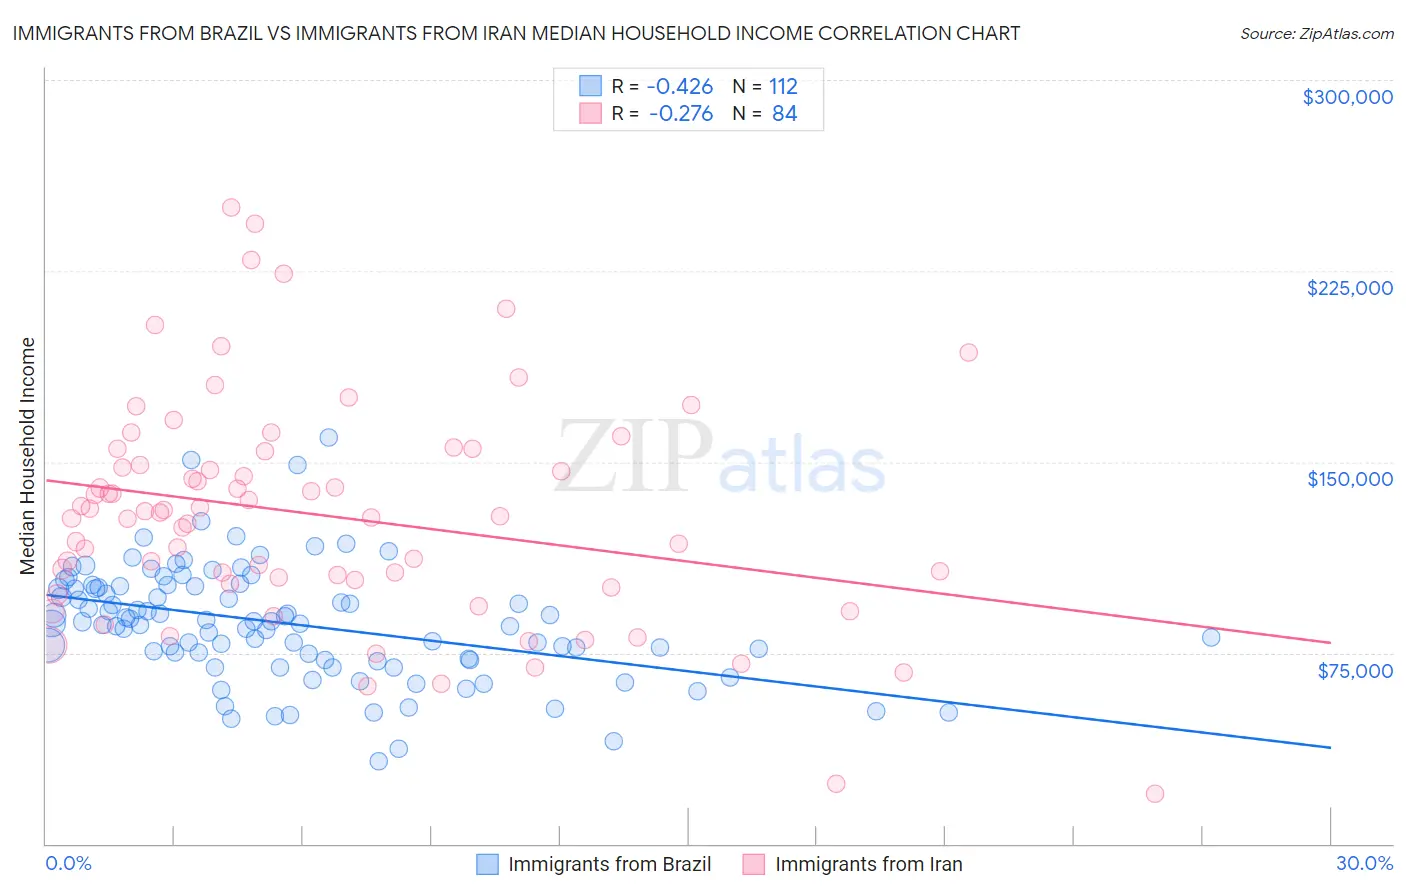
Immigrants from Brazil vs Immigrants from Iran Median Household Income Correlation Chart
The statistical analysis conducted on geographies consisting of 342,806,589 people shows a moderate negative correlation between the proportion of Immigrants from Brazil and median household income in the United States with a correlation coefficient (R) of -0.426 and weighted average of $90,907. Similarly, the statistical analysis conducted on geographies consisting of 279,821,960 people shows a weak negative correlation between the proportion of Immigrants from Iran and median household income in the United States with a correlation coefficient (R) of -0.276 and weighted average of $108,055, a difference of 18.9%.
Median Household Income Correlation Summary
| Measurement | Immigrants from Brazil | Immigrants from Iran |
| Minimum | $32,591 | $19,722 |
| Maximum | $159,719 | $250,001 |
| Range | $127,128 | $230,279 |
| Mean | $86,451 | $128,949 |
| Median | $86,864 | $129,200 |
| Interquartile 25% (IQ1) | $72,377 | $102,878 |
| Interquartile 75% (IQ3) | $100,910 | $151,481 |
| Interquartile Range (IQR) | $28,533 | $48,604 |
| Standard Deviation (Sample) | $22,561 | $44,216 |
| Standard Deviation (Population) | $22,460 | $43,952 |
Similar Demographics by Median Household Income
Demographics Similar to Immigrants from Brazil by Median Household Income
In terms of median household income, the demographic groups most similar to Immigrants from Brazil are Immigrants from Kazakhstan ($91,015, a difference of 0.12%), Macedonian ($90,761, a difference of 0.16%), Immigrants from Ukraine ($91,124, a difference of 0.24%), Croatian ($90,685, a difference of 0.25%), and Zimbabwean ($90,618, a difference of 0.32%).
| Demographics | Rating | Rank | Median Household Income |
| Immigrants | Southern Europe | 98.5 /100 | #98 | Exceptional $91,605 |
| Immigrants | South Eastern Asia | 98.4 /100 | #99 | Exceptional $91,541 |
| Ukrainians | 98.3 /100 | #100 | Exceptional $91,456 |
| Immigrants | Moldova | 98.3 /100 | #101 | Exceptional $91,446 |
| Austrians | 98.2 /100 | #102 | Exceptional $91,339 |
| Immigrants | Ukraine | 98.0 /100 | #103 | Exceptional $91,124 |
| Immigrants | Kazakhstan | 97.8 /100 | #104 | Exceptional $91,015 |
| Immigrants | Brazil | 97.7 /100 | #105 | Exceptional $90,907 |
| Macedonians | 97.4 /100 | #106 | Exceptional $90,761 |
| Croatians | 97.3 /100 | #107 | Exceptional $90,685 |
| Zimbabweans | 97.2 /100 | #108 | Exceptional $90,618 |
| Chileans | 97.2 /100 | #109 | Exceptional $90,605 |
| Palestinians | 97.1 /100 | #110 | Exceptional $90,574 |
| Immigrants | Poland | 97.1 /100 | #111 | Exceptional $90,549 |
| Northern Europeans | 96.9 /100 | #112 | Exceptional $90,446 |
Demographics Similar to Immigrants from Iran by Median Household Income
In terms of median household income, the demographic groups most similar to Immigrants from Iran are Okinawan ($106,624, a difference of 1.3%), Iranian ($109,835, a difference of 1.7%), Immigrants from South Central Asia ($106,057, a difference of 1.9%), Immigrants from Singapore ($110,428, a difference of 2.2%), and Thai ($110,648, a difference of 2.4%).
| Demographics | Rating | Rank | Median Household Income |
| Immigrants | Taiwan | 100.0 /100 | #1 | Exceptional $116,460 |
| Filipinos | 100.0 /100 | #2 | Exceptional $115,509 |
| Immigrants | India | 100.0 /100 | #3 | Exceptional $113,009 |
| Immigrants | Hong Kong | 100.0 /100 | #4 | Exceptional $111,519 |
| Thais | 100.0 /100 | #5 | Exceptional $110,648 |
| Immigrants | Singapore | 100.0 /100 | #6 | Exceptional $110,428 |
| Iranians | 100.0 /100 | #7 | Exceptional $109,835 |
| Immigrants | Iran | 100.0 /100 | #8 | Exceptional $108,055 |
| Okinawans | 100.0 /100 | #9 | Exceptional $106,624 |
| Immigrants | South Central Asia | 100.0 /100 | #10 | Exceptional $106,057 |
| Immigrants | China | 100.0 /100 | #11 | Exceptional $105,335 |
| Indians (Asian) | 100.0 /100 | #12 | Exceptional $105,262 |
| Immigrants | Eastern Asia | 100.0 /100 | #13 | Exceptional $104,796 |
| Immigrants | Ireland | 100.0 /100 | #14 | Exceptional $104,692 |
| Immigrants | Israel | 100.0 /100 | #15 | Exceptional $104,090 |