Immigrants from Belize vs Immigrants from Dominican Republic Unemployment Among Ages 30 to 34 years
COMPARE
Immigrants from Belize
Immigrants from Dominican Republic
Unemployment Among Ages 30 to 34 years
Unemployment Among Ages 30 to 34 years Comparison
Immigrants from Belize
Immigrants from Dominican Republic
6.9%
UNEMPLOYMENT AMONG AGES 30 TO 34 YEARS
0.0/ 100
METRIC RATING
307th/ 347
METRIC RANK
7.7%
UNEMPLOYMENT AMONG AGES 30 TO 34 YEARS
0.0/ 100
METRIC RATING
327th/ 347
METRIC RANK
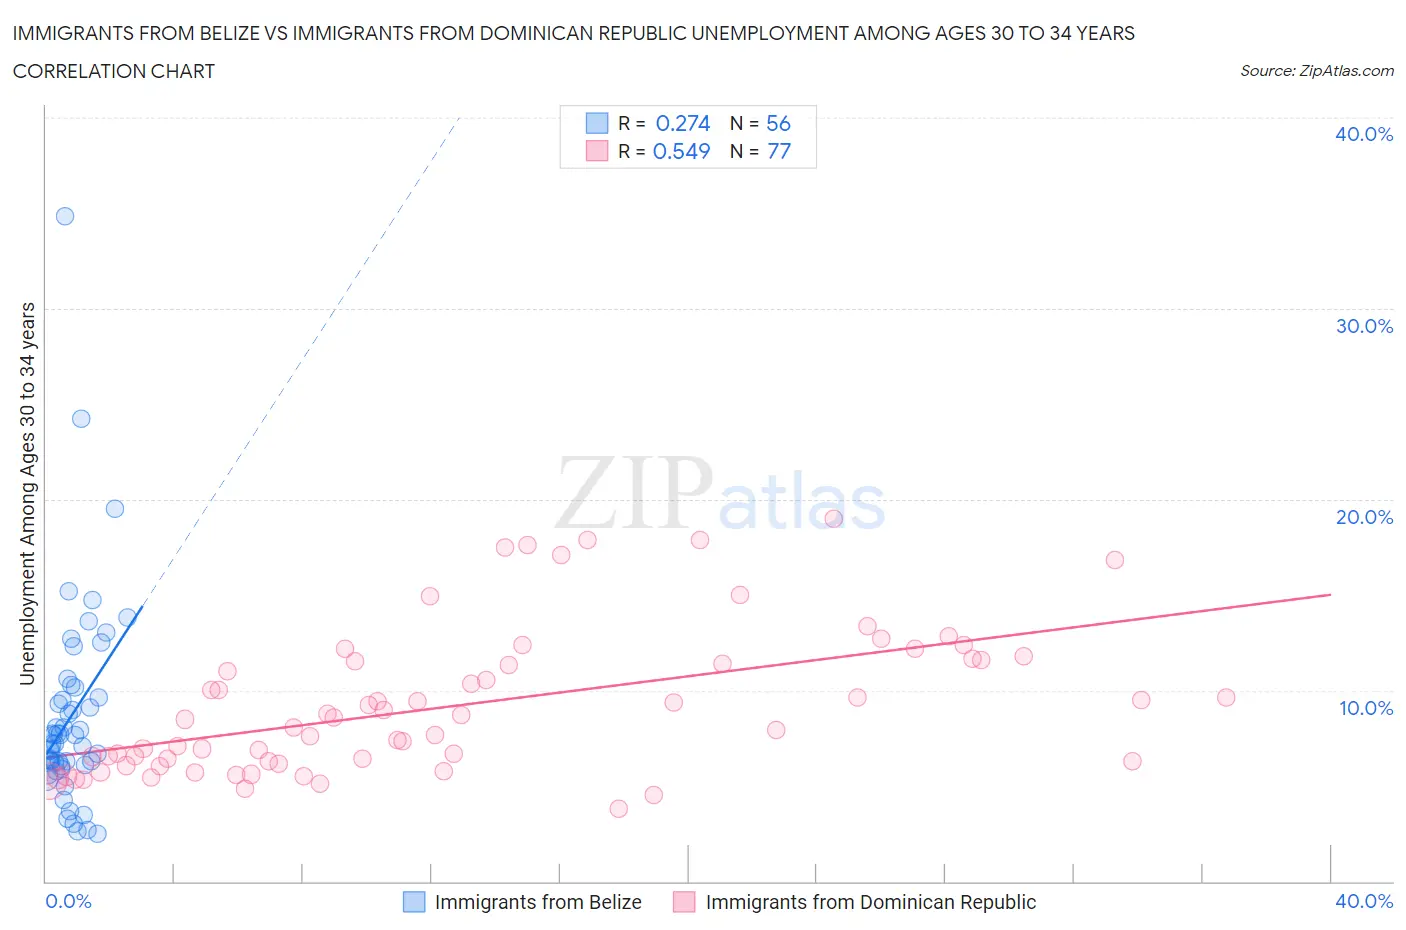
Immigrants from Belize vs Immigrants from Dominican Republic Unemployment Among Ages 30 to 34 years Correlation Chart
The statistical analysis conducted on geographies consisting of 128,396,908 people shows a weak positive correlation between the proportion of Immigrants from Belize and unemployment rate among population between the ages 30 and 34 in the United States with a correlation coefficient (R) of 0.274 and weighted average of 6.9%. Similarly, the statistical analysis conducted on geographies consisting of 263,148,059 people shows a substantial positive correlation between the proportion of Immigrants from Dominican Republic and unemployment rate among population between the ages 30 and 34 in the United States with a correlation coefficient (R) of 0.549 and weighted average of 7.7%, a difference of 12.8%.
Unemployment Among Ages 30 to 34 years Correlation Summary
| Measurement | Immigrants from Belize | Immigrants from Dominican Republic |
| Minimum | 2.5% | 3.8% |
| Maximum | 34.8% | 19.0% |
| Range | 32.3% | 15.2% |
| Mean | 8.7% | 9.2% |
| Median | 7.4% | 8.5% |
| Interquartile 25% (IQ1) | 6.0% | 6.2% |
| Interquartile 75% (IQ3) | 9.9% | 11.6% |
| Interquartile Range (IQR) | 3.8% | 5.4% |
| Standard Deviation (Sample) | 5.4% | 3.8% |
| Standard Deviation (Population) | 5.4% | 3.7% |
Demographics Similar to Immigrants from Belize and Immigrants from Dominican Republic by Unemployment Among Ages 30 to 34 years
In terms of unemployment among ages 30 to 34 years, the demographic groups most similar to Immigrants from Belize are Immigrants from the Azores (6.9%, a difference of 0.38%), Immigrants from Grenada (6.9%, a difference of 1.1%), Immigrants from St. Vincent and the Grenadines (7.0%, a difference of 1.4%), Alaskan Athabascan (7.0%, a difference of 2.5%), and British West Indian (7.0%, a difference of 2.6%). Similarly, the demographic groups most similar to Immigrants from Dominican Republic are Dominican (7.7%, a difference of 0.72%), Apache (7.3%, a difference of 5.4%), Immigrants from Dominica (7.3%, a difference of 5.7%), Immigrants from Yemen (7.3%, a difference of 6.3%), and Marshallese (7.2%, a difference of 6.8%).
| Demographics | Rating | Rank | Unemployment Among Ages 30 to 34 years |
| Immigrants | Belize | 0.0 /100 | #307 | Tragic 6.9% |
| Immigrants | Azores | 0.0 /100 | #308 | Tragic 6.9% |
| Immigrants | Grenada | 0.0 /100 | #309 | Tragic 6.9% |
| Immigrants | St. Vincent and the Grenadines | 0.0 /100 | #310 | Tragic 7.0% |
| Alaskan Athabascans | 0.0 /100 | #311 | Tragic 7.0% |
| British West Indians | 0.0 /100 | #312 | Tragic 7.0% |
| Ute | 0.0 /100 | #313 | Tragic 7.0% |
| Lumbee | 0.0 /100 | #314 | Tragic 7.1% |
| Aleuts | 0.0 /100 | #315 | Tragic 7.1% |
| Houma | 0.0 /100 | #316 | Tragic 7.2% |
| Immigrants | Cabo Verde | 0.0 /100 | #317 | Tragic 7.2% |
| Blacks/African Americans | 0.0 /100 | #318 | Tragic 7.2% |
| Guyanese | 0.0 /100 | #319 | Tragic 7.2% |
| Cape Verdeans | 0.0 /100 | #320 | Tragic 7.2% |
| Immigrants | Guyana | 0.0 /100 | #321 | Tragic 7.2% |
| Marshallese | 0.0 /100 | #322 | Tragic 7.2% |
| Immigrants | Yemen | 0.0 /100 | #323 | Tragic 7.3% |
| Immigrants | Dominica | 0.0 /100 | #324 | Tragic 7.3% |
| Apache | 0.0 /100 | #325 | Tragic 7.3% |
| Dominicans | 0.0 /100 | #326 | Tragic 7.7% |
| Immigrants | Dominican Republic | 0.0 /100 | #327 | Tragic 7.7% |