Tohono O'odham vs Immigrants from Dominican Republic Unemployment Among Ages 30 to 34 years
COMPARE
Tohono O'odham
Immigrants from Dominican Republic
Unemployment Among Ages 30 to 34 years
Unemployment Among Ages 30 to 34 years Comparison
Tohono O'odham
Immigrants from Dominican Republic
9.8%
UNEMPLOYMENT AMONG AGES 30 TO 34 YEARS
0.0/ 100
METRIC RATING
339th/ 347
METRIC RANK
7.7%
UNEMPLOYMENT AMONG AGES 30 TO 34 YEARS
0.0/ 100
METRIC RATING
327th/ 347
METRIC RANK
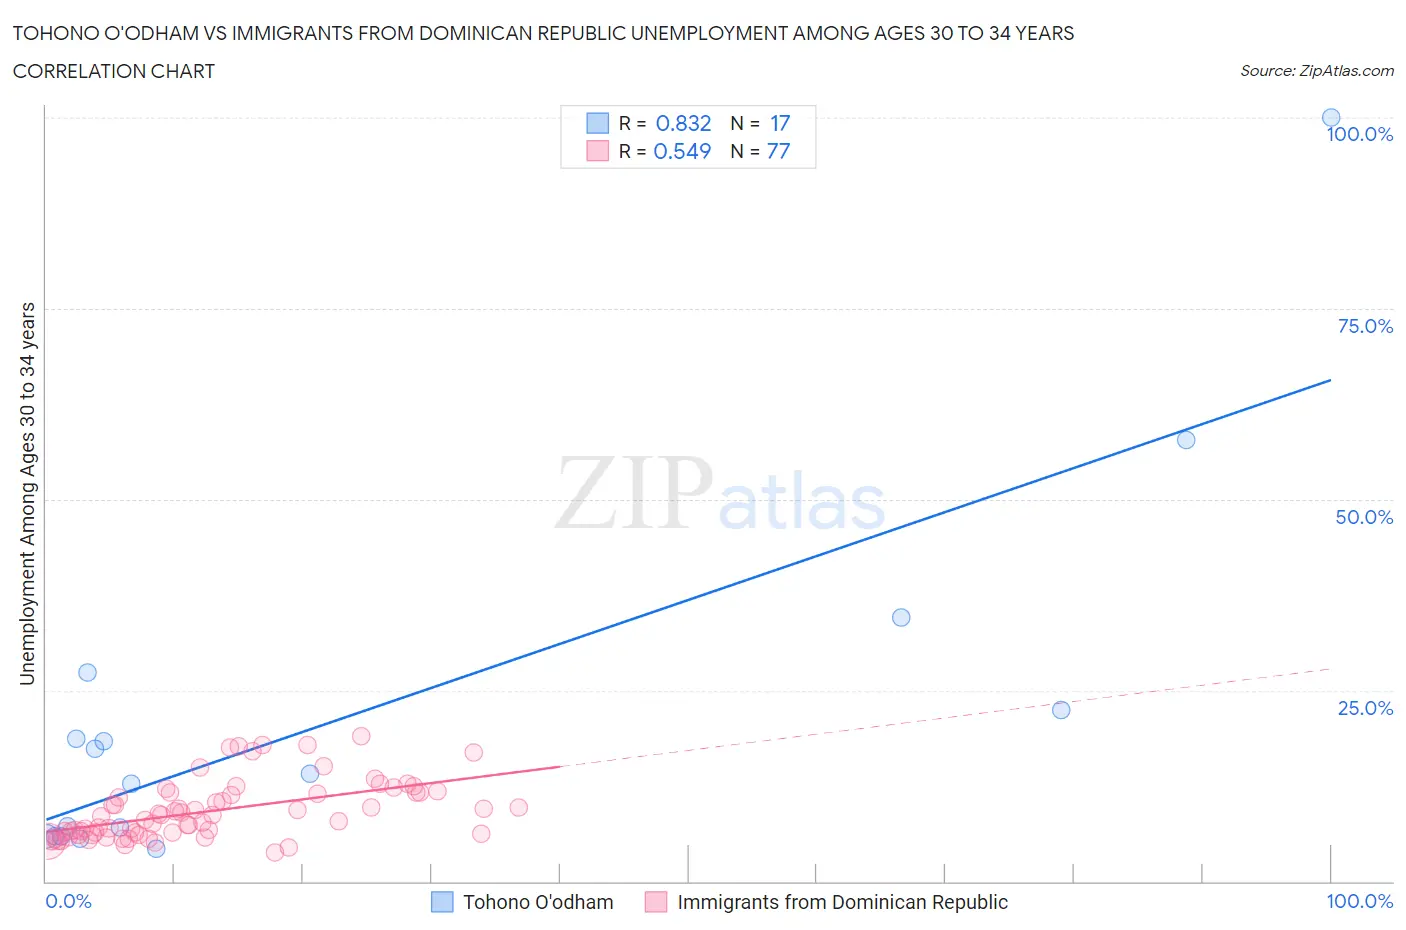
Tohono O'odham vs Immigrants from Dominican Republic Unemployment Among Ages 30 to 34 years Correlation Chart
The statistical analysis conducted on geographies consisting of 58,211,383 people shows a very strong positive correlation between the proportion of Tohono O'odham and unemployment rate among population between the ages 30 and 34 in the United States with a correlation coefficient (R) of 0.832 and weighted average of 9.8%. Similarly, the statistical analysis conducted on geographies consisting of 263,148,059 people shows a substantial positive correlation between the proportion of Immigrants from Dominican Republic and unemployment rate among population between the ages 30 and 34 in the United States with a correlation coefficient (R) of 0.549 and weighted average of 7.7%, a difference of 27.1%.
Unemployment Among Ages 30 to 34 years Correlation Summary
| Measurement | Tohono O'odham | Immigrants from Dominican Republic |
| Minimum | 4.3% | 3.8% |
| Maximum | 100.0% | 19.0% |
| Range | 95.7% | 15.2% |
| Mean | 21.5% | 9.2% |
| Median | 14.1% | 8.5% |
| Interquartile 25% (IQ1) | 5.9% | 6.2% |
| Interquartile 75% (IQ3) | 24.9% | 11.6% |
| Interquartile Range (IQR) | 19.0% | 5.4% |
| Standard Deviation (Sample) | 24.4% | 3.8% |
| Standard Deviation (Population) | 23.7% | 3.7% |
Demographics Similar to Tohono O'odham and Immigrants from Dominican Republic by Unemployment Among Ages 30 to 34 years
In terms of unemployment among ages 30 to 34 years, the demographic groups most similar to Tohono O'odham are Yakama (9.8%, a difference of 0.71%), Pima (9.6%, a difference of 1.9%), Crow (10.3%, a difference of 5.2%), Navajo (10.6%, a difference of 7.3%), and Yuman (10.6%, a difference of 7.8%). Similarly, the demographic groups most similar to Immigrants from Dominican Republic are Chippewa (7.8%, a difference of 0.27%), Dominican (7.7%, a difference of 0.72%), Cheyenne (7.8%, a difference of 1.3%), Shoshone (7.9%, a difference of 2.3%), and Sioux (8.0%, a difference of 3.7%).
| Demographics | Rating | Rank | Unemployment Among Ages 30 to 34 years |
| Immigrants | Yemen | 0.0 /100 | #323 | Tragic 7.3% |
| Immigrants | Dominica | 0.0 /100 | #324 | Tragic 7.3% |
| Apache | 0.0 /100 | #325 | Tragic 7.3% |
| Dominicans | 0.0 /100 | #326 | Tragic 7.7% |
| Immigrants | Dominican Republic | 0.0 /100 | #327 | Tragic 7.7% |
| Chippewa | 0.0 /100 | #328 | Tragic 7.8% |
| Cheyenne | 0.0 /100 | #329 | Tragic 7.8% |
| Shoshone | 0.0 /100 | #330 | Tragic 7.9% |
| Sioux | 0.0 /100 | #331 | Tragic 8.0% |
| Natives/Alaskans | 0.0 /100 | #332 | Tragic 8.2% |
| Pueblo | 0.0 /100 | #333 | Tragic 8.3% |
| Alaska Natives | 0.0 /100 | #334 | Tragic 8.5% |
| Puerto Ricans | 0.0 /100 | #335 | Tragic 8.9% |
| Colville | 0.0 /100 | #336 | Tragic 9.0% |
| Pima | 0.0 /100 | #337 | Tragic 9.6% |
| Yakama | 0.0 /100 | #338 | Tragic 9.8% |
| Tohono O'odham | 0.0 /100 | #339 | Tragic 9.8% |
| Crow | 0.0 /100 | #340 | Tragic 10.3% |
| Navajo | 0.0 /100 | #341 | Tragic 10.6% |
| Yuman | 0.0 /100 | #342 | Tragic 10.6% |
| Inupiat | 0.0 /100 | #343 | Tragic 10.8% |