Immigrants from Belize vs Malaysian Unemployment Among Ages 30 to 34 years
COMPARE
Immigrants from Belize
Malaysian
Unemployment Among Ages 30 to 34 years
Unemployment Among Ages 30 to 34 years Comparison
Immigrants from Belize
Malaysians
6.9%
UNEMPLOYMENT AMONG AGES 30 TO 34 YEARS
0.0/ 100
METRIC RATING
307th/ 347
METRIC RANK
5.5%
UNEMPLOYMENT AMONG AGES 30 TO 34 YEARS
41.8/ 100
METRIC RATING
184th/ 347
METRIC RANK
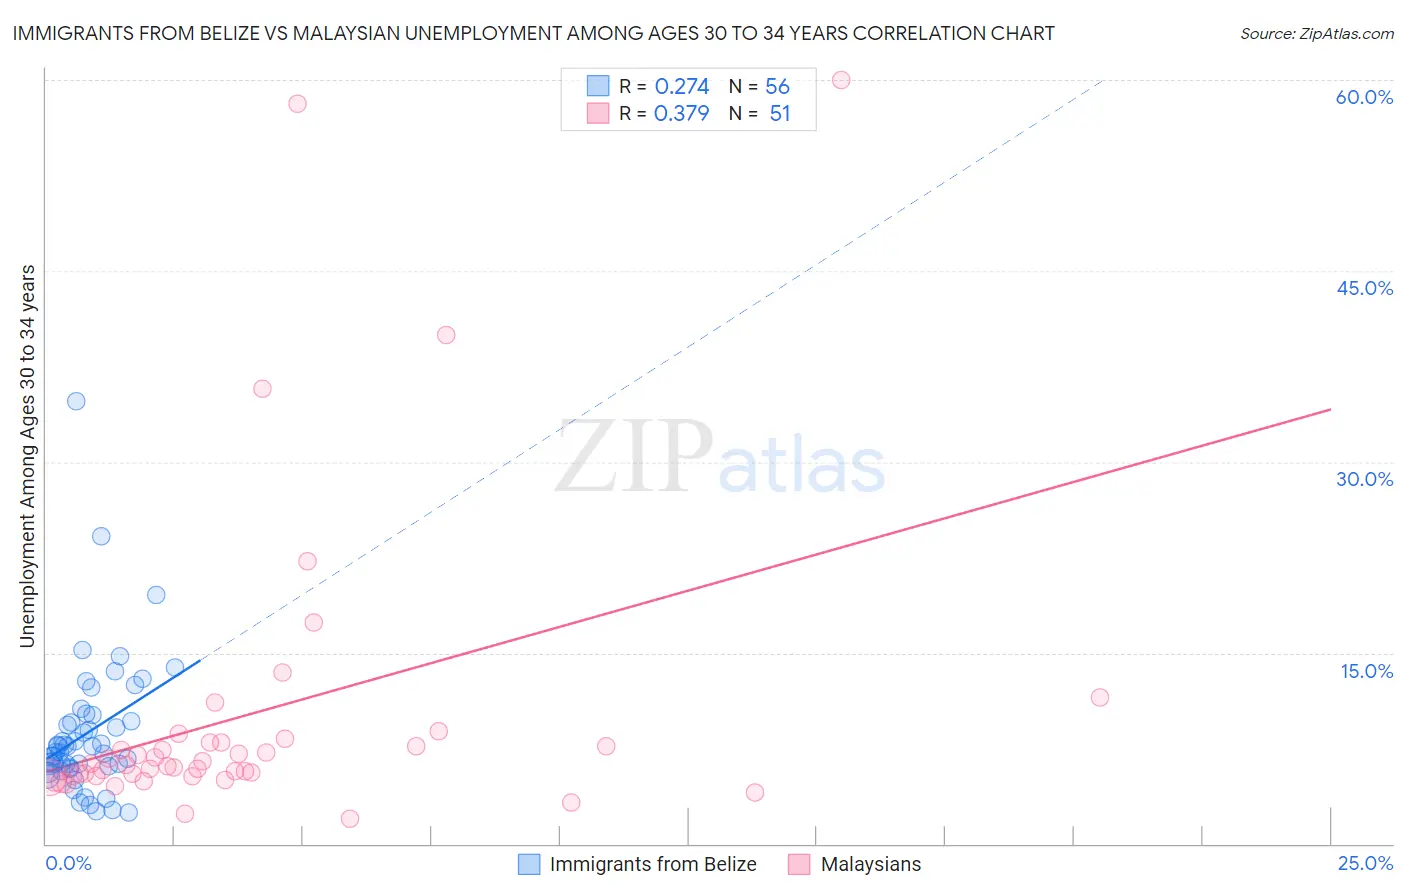
Immigrants from Belize vs Malaysian Unemployment Among Ages 30 to 34 years Correlation Chart
The statistical analysis conducted on geographies consisting of 128,396,908 people shows a weak positive correlation between the proportion of Immigrants from Belize and unemployment rate among population between the ages 30 and 34 in the United States with a correlation coefficient (R) of 0.274 and weighted average of 6.9%. Similarly, the statistical analysis conducted on geographies consisting of 219,995,720 people shows a mild positive correlation between the proportion of Malaysians and unemployment rate among population between the ages 30 and 34 in the United States with a correlation coefficient (R) of 0.379 and weighted average of 5.5%, a difference of 24.9%.
Unemployment Among Ages 30 to 34 years Correlation Summary
| Measurement | Immigrants from Belize | Malaysian |
| Minimum | 2.5% | 2.0% |
| Maximum | 34.8% | 60.0% |
| Range | 32.3% | 58.0% |
| Mean | 8.7% | 10.2% |
| Median | 7.4% | 6.2% |
| Interquartile 25% (IQ1) | 6.0% | 5.3% |
| Interquartile 75% (IQ3) | 9.9% | 8.0% |
| Interquartile Range (IQR) | 3.8% | 2.7% |
| Standard Deviation (Sample) | 5.4% | 12.1% |
| Standard Deviation (Population) | 5.4% | 12.0% |
Similar Demographics by Unemployment Among Ages 30 to 34 years
Demographics Similar to Immigrants from Belize by Unemployment Among Ages 30 to 34 years
In terms of unemployment among ages 30 to 34 years, the demographic groups most similar to Immigrants from Belize are Immigrants from Armenia (6.8%, a difference of 0.19%), Immigrants from the Azores (6.9%, a difference of 0.38%), Immigrants from Grenada (6.9%, a difference of 1.1%), Immigrants from St. Vincent and the Grenadines (7.0%, a difference of 1.4%), and Paiute (6.7%, a difference of 2.4%).
| Demographics | Rating | Rank | Unemployment Among Ages 30 to 34 years |
| Bahamians | 0.0 /100 | #300 | Tragic 6.6% |
| Belizeans | 0.0 /100 | #301 | Tragic 6.6% |
| Delaware | 0.0 /100 | #302 | Tragic 6.7% |
| Cajuns | 0.0 /100 | #303 | Tragic 6.7% |
| Kiowa | 0.0 /100 | #304 | Tragic 6.7% |
| Paiute | 0.0 /100 | #305 | Tragic 6.7% |
| Immigrants | Armenia | 0.0 /100 | #306 | Tragic 6.8% |
| Immigrants | Belize | 0.0 /100 | #307 | Tragic 6.9% |
| Immigrants | Azores | 0.0 /100 | #308 | Tragic 6.9% |
| Immigrants | Grenada | 0.0 /100 | #309 | Tragic 6.9% |
| Immigrants | St. Vincent and the Grenadines | 0.0 /100 | #310 | Tragic 7.0% |
| Alaskan Athabascans | 0.0 /100 | #311 | Tragic 7.0% |
| British West Indians | 0.0 /100 | #312 | Tragic 7.0% |
| Ute | 0.0 /100 | #313 | Tragic 7.0% |
| Lumbee | 0.0 /100 | #314 | Tragic 7.1% |
Demographics Similar to Malaysians by Unemployment Among Ages 30 to 34 years
In terms of unemployment among ages 30 to 34 years, the demographic groups most similar to Malaysians are Hungarian (5.5%, a difference of 0.090%), Immigrants from Denmark (5.5%, a difference of 0.11%), Immigrants from Lebanon (5.5%, a difference of 0.12%), Immigrants from Western Europe (5.5%, a difference of 0.19%), and Canadian (5.5%, a difference of 0.25%).
| Demographics | Rating | Rank | Unemployment Among Ages 30 to 34 years |
| Immigrants | Ukraine | 47.7 /100 | #177 | Average 5.5% |
| Macedonians | 47.1 /100 | #178 | Average 5.5% |
| Costa Ricans | 46.7 /100 | #179 | Average 5.5% |
| Italians | 45.5 /100 | #180 | Average 5.5% |
| Immigrants | Lebanon | 43.5 /100 | #181 | Average 5.5% |
| Immigrants | Denmark | 43.4 /100 | #182 | Average 5.5% |
| Hungarians | 43.1 /100 | #183 | Average 5.5% |
| Malaysians | 41.8 /100 | #184 | Average 5.5% |
| Immigrants | Western Europe | 39.1 /100 | #185 | Fair 5.5% |
| Canadians | 38.2 /100 | #186 | Fair 5.5% |
| Immigrants | Western Asia | 38.2 /100 | #187 | Fair 5.5% |
| Immigrants | Norway | 36.1 /100 | #188 | Fair 5.5% |
| Immigrants | England | 35.7 /100 | #189 | Fair 5.5% |
| Immigrants | Kazakhstan | 33.9 /100 | #190 | Fair 5.5% |
| Irish | 31.3 /100 | #191 | Fair 5.5% |