Yugoslavian vs Immigrants from Dominican Republic Unemployment Among Ages 30 to 34 years
COMPARE
Yugoslavian
Immigrants from Dominican Republic
Unemployment Among Ages 30 to 34 years
Unemployment Among Ages 30 to 34 years Comparison
Yugoslavians
Immigrants from Dominican Republic
5.1%
UNEMPLOYMENT AMONG AGES 30 TO 34 YEARS
98.6/ 100
METRIC RATING
45th/ 347
METRIC RANK
7.7%
UNEMPLOYMENT AMONG AGES 30 TO 34 YEARS
0.0/ 100
METRIC RATING
327th/ 347
METRIC RANK
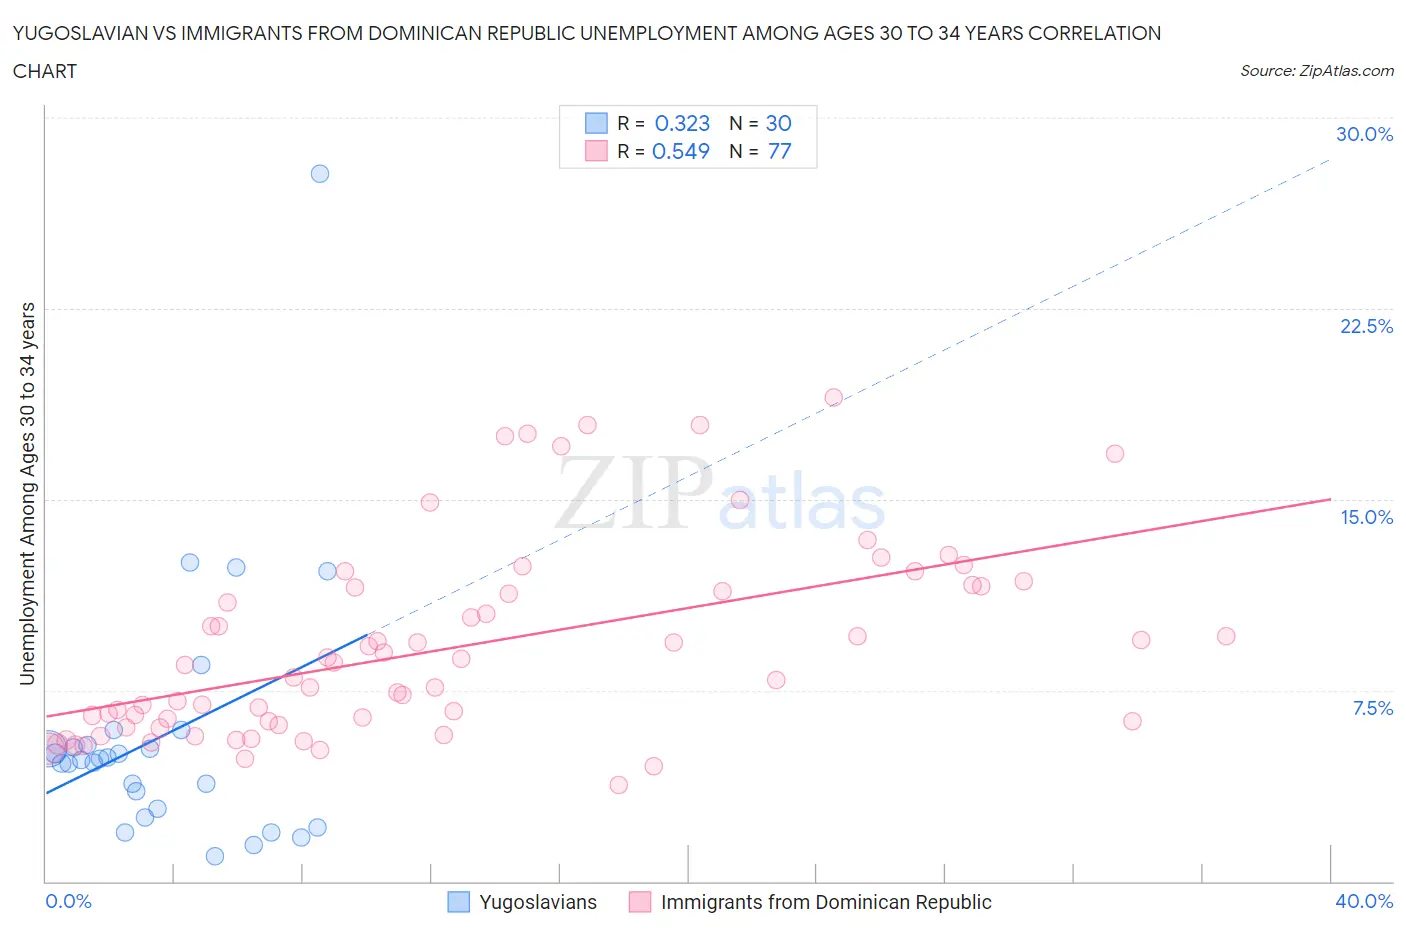
Yugoslavian vs Immigrants from Dominican Republic Unemployment Among Ages 30 to 34 years Correlation Chart
The statistical analysis conducted on geographies consisting of 272,496,305 people shows a mild positive correlation between the proportion of Yugoslavians and unemployment rate among population between the ages 30 and 34 in the United States with a correlation coefficient (R) of 0.323 and weighted average of 5.1%. Similarly, the statistical analysis conducted on geographies consisting of 263,148,059 people shows a substantial positive correlation between the proportion of Immigrants from Dominican Republic and unemployment rate among population between the ages 30 and 34 in the United States with a correlation coefficient (R) of 0.549 and weighted average of 7.7%, a difference of 53.1%.
Unemployment Among Ages 30 to 34 years Correlation Summary
| Measurement | Yugoslavian | Immigrants from Dominican Republic |
| Minimum | 1.0% | 3.8% |
| Maximum | 27.8% | 19.0% |
| Range | 26.8% | 15.2% |
| Mean | 5.7% | 9.2% |
| Median | 4.8% | 8.5% |
| Interquartile 25% (IQ1) | 2.9% | 6.2% |
| Interquartile 75% (IQ3) | 5.3% | 11.6% |
| Interquartile Range (IQR) | 2.5% | 5.4% |
| Standard Deviation (Sample) | 5.1% | 3.8% |
| Standard Deviation (Population) | 5.0% | 3.7% |
Similar Demographics by Unemployment Among Ages 30 to 34 years
Demographics Similar to Yugoslavians by Unemployment Among Ages 30 to 34 years
In terms of unemployment among ages 30 to 34 years, the demographic groups most similar to Yugoslavians are Immigrants from Belgium (5.1%, a difference of 0.030%), Soviet Union (5.0%, a difference of 0.17%), Immigrants from Hong Kong (5.0%, a difference of 0.28%), Immigrants from Congo (5.1%, a difference of 0.30%), and Cypriot (5.1%, a difference of 0.33%).
| Demographics | Rating | Rank | Unemployment Among Ages 30 to 34 years |
| Sri Lankans | 99.0 /100 | #38 | Exceptional 5.0% |
| Fijians | 99.0 /100 | #39 | Exceptional 5.0% |
| Immigrants | Vietnam | 98.9 /100 | #40 | Exceptional 5.0% |
| Immigrants | Eastern Africa | 98.9 /100 | #41 | Exceptional 5.0% |
| Immigrants | Hong Kong | 98.8 /100 | #42 | Exceptional 5.0% |
| Soviet Union | 98.8 /100 | #43 | Exceptional 5.0% |
| Immigrants | Belgium | 98.7 /100 | #44 | Exceptional 5.1% |
| Yugoslavians | 98.6 /100 | #45 | Exceptional 5.1% |
| Immigrants | Congo | 98.4 /100 | #46 | Exceptional 5.1% |
| Cypriots | 98.4 /100 | #47 | Exceptional 5.1% |
| Assyrians/Chaldeans/Syriacs | 98.4 /100 | #48 | Exceptional 5.1% |
| Immigrants | Malaysia | 98.3 /100 | #49 | Exceptional 5.1% |
| Puget Sound Salish | 98.2 /100 | #50 | Exceptional 5.1% |
| Turks | 98.2 /100 | #51 | Exceptional 5.1% |
| Immigrants | Burma/Myanmar | 98.1 /100 | #52 | Exceptional 5.1% |
Demographics Similar to Immigrants from Dominican Republic by Unemployment Among Ages 30 to 34 years
In terms of unemployment among ages 30 to 34 years, the demographic groups most similar to Immigrants from Dominican Republic are Chippewa (7.8%, a difference of 0.27%), Dominican (7.7%, a difference of 0.72%), Cheyenne (7.8%, a difference of 1.3%), Shoshone (7.9%, a difference of 2.3%), and Sioux (8.0%, a difference of 3.7%).
| Demographics | Rating | Rank | Unemployment Among Ages 30 to 34 years |
| Cape Verdeans | 0.0 /100 | #320 | Tragic 7.2% |
| Immigrants | Guyana | 0.0 /100 | #321 | Tragic 7.2% |
| Marshallese | 0.0 /100 | #322 | Tragic 7.2% |
| Immigrants | Yemen | 0.0 /100 | #323 | Tragic 7.3% |
| Immigrants | Dominica | 0.0 /100 | #324 | Tragic 7.3% |
| Apache | 0.0 /100 | #325 | Tragic 7.3% |
| Dominicans | 0.0 /100 | #326 | Tragic 7.7% |
| Immigrants | Dominican Republic | 0.0 /100 | #327 | Tragic 7.7% |
| Chippewa | 0.0 /100 | #328 | Tragic 7.8% |
| Cheyenne | 0.0 /100 | #329 | Tragic 7.8% |
| Shoshone | 0.0 /100 | #330 | Tragic 7.9% |
| Sioux | 0.0 /100 | #331 | Tragic 8.0% |
| Natives/Alaskans | 0.0 /100 | #332 | Tragic 8.2% |
| Pueblo | 0.0 /100 | #333 | Tragic 8.3% |
| Alaska Natives | 0.0 /100 | #334 | Tragic 8.5% |