Immigrants from Belize vs Immigrants from South Central Asia Unemployment Among Ages 30 to 34 years
COMPARE
Immigrants from Belize
Immigrants from South Central Asia
Unemployment Among Ages 30 to 34 years
Unemployment Among Ages 30 to 34 years Comparison
Immigrants from Belize
Immigrants from South Central Asia
6.9%
UNEMPLOYMENT AMONG AGES 30 TO 34 YEARS
0.0/ 100
METRIC RATING
307th/ 347
METRIC RANK
4.9%
UNEMPLOYMENT AMONG AGES 30 TO 34 YEARS
99.8/ 100
METRIC RATING
22nd/ 347
METRIC RANK
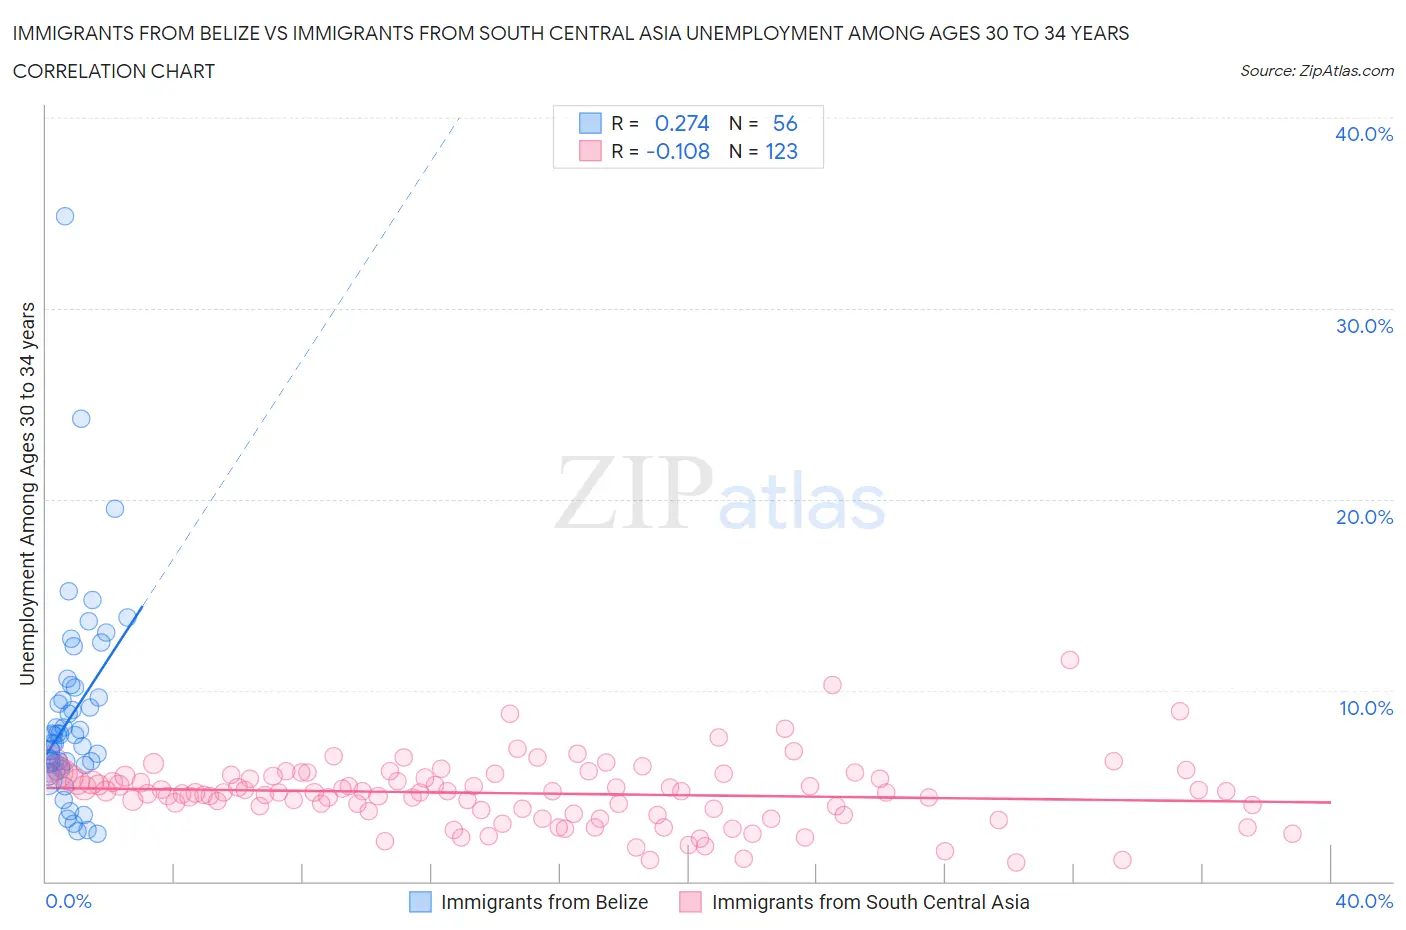
Immigrants from Belize vs Immigrants from South Central Asia Unemployment Among Ages 30 to 34 years Correlation Chart
The statistical analysis conducted on geographies consisting of 128,396,908 people shows a weak positive correlation between the proportion of Immigrants from Belize and unemployment rate among population between the ages 30 and 34 in the United States with a correlation coefficient (R) of 0.274 and weighted average of 6.9%. Similarly, the statistical analysis conducted on geographies consisting of 438,623,185 people shows a poor negative correlation between the proportion of Immigrants from South Central Asia and unemployment rate among population between the ages 30 and 34 in the United States with a correlation coefficient (R) of -0.108 and weighted average of 4.9%, a difference of 40.8%.
Unemployment Among Ages 30 to 34 years Correlation Summary
| Measurement | Immigrants from Belize | Immigrants from South Central Asia |
| Minimum | 2.5% | 1.0% |
| Maximum | 34.8% | 11.6% |
| Range | 32.3% | 10.6% |
| Mean | 8.7% | 4.6% |
| Median | 7.4% | 4.7% |
| Interquartile 25% (IQ1) | 6.0% | 3.7% |
| Interquartile 75% (IQ3) | 9.9% | 5.5% |
| Interquartile Range (IQR) | 3.8% | 1.8% |
| Standard Deviation (Sample) | 5.4% | 1.7% |
| Standard Deviation (Population) | 5.4% | 1.7% |
Similar Demographics by Unemployment Among Ages 30 to 34 years
Demographics Similar to Immigrants from Belize by Unemployment Among Ages 30 to 34 years
In terms of unemployment among ages 30 to 34 years, the demographic groups most similar to Immigrants from Belize are Immigrants from Armenia (6.8%, a difference of 0.19%), Immigrants from the Azores (6.9%, a difference of 0.38%), Immigrants from Grenada (6.9%, a difference of 1.1%), Immigrants from St. Vincent and the Grenadines (7.0%, a difference of 1.4%), and Paiute (6.7%, a difference of 2.4%).
| Demographics | Rating | Rank | Unemployment Among Ages 30 to 34 years |
| Bahamians | 0.0 /100 | #300 | Tragic 6.6% |
| Belizeans | 0.0 /100 | #301 | Tragic 6.6% |
| Delaware | 0.0 /100 | #302 | Tragic 6.7% |
| Cajuns | 0.0 /100 | #303 | Tragic 6.7% |
| Kiowa | 0.0 /100 | #304 | Tragic 6.7% |
| Paiute | 0.0 /100 | #305 | Tragic 6.7% |
| Immigrants | Armenia | 0.0 /100 | #306 | Tragic 6.8% |
| Immigrants | Belize | 0.0 /100 | #307 | Tragic 6.9% |
| Immigrants | Azores | 0.0 /100 | #308 | Tragic 6.9% |
| Immigrants | Grenada | 0.0 /100 | #309 | Tragic 6.9% |
| Immigrants | St. Vincent and the Grenadines | 0.0 /100 | #310 | Tragic 7.0% |
| Alaskan Athabascans | 0.0 /100 | #311 | Tragic 7.0% |
| British West Indians | 0.0 /100 | #312 | Tragic 7.0% |
| Ute | 0.0 /100 | #313 | Tragic 7.0% |
| Lumbee | 0.0 /100 | #314 | Tragic 7.1% |
Demographics Similar to Immigrants from South Central Asia by Unemployment Among Ages 30 to 34 years
In terms of unemployment among ages 30 to 34 years, the demographic groups most similar to Immigrants from South Central Asia are Hmong (4.9%, a difference of 0.17%), Ethiopian (4.9%, a difference of 0.21%), Immigrants from Taiwan (4.9%, a difference of 0.22%), Immigrants from Sudan (4.9%, a difference of 0.24%), and Bolivian (4.9%, a difference of 0.30%).
| Demographics | Rating | Rank | Unemployment Among Ages 30 to 34 years |
| Okinawans | 99.9 /100 | #15 | Exceptional 4.8% |
| Zimbabweans | 99.9 /100 | #16 | Exceptional 4.8% |
| Immigrants | Bulgaria | 99.9 /100 | #17 | Exceptional 4.8% |
| Bolivians | 99.8 /100 | #18 | Exceptional 4.9% |
| Immigrants | Sudan | 99.8 /100 | #19 | Exceptional 4.9% |
| Immigrants | Taiwan | 99.8 /100 | #20 | Exceptional 4.9% |
| Ethiopians | 99.8 /100 | #21 | Exceptional 4.9% |
| Immigrants | South Central Asia | 99.8 /100 | #22 | Exceptional 4.9% |
| Hmong | 99.8 /100 | #23 | Exceptional 4.9% |
| Ugandans | 99.7 /100 | #24 | Exceptional 4.9% |
| Immigrants | Singapore | 99.5 /100 | #25 | Exceptional 5.0% |
| Immigrants | Kuwait | 99.5 /100 | #26 | Exceptional 5.0% |
| Danes | 99.5 /100 | #27 | Exceptional 5.0% |
| Immigrants | Cuba | 99.4 /100 | #28 | Exceptional 5.0% |
| German Russians | 99.4 /100 | #29 | Exceptional 5.0% |