Immigrants from Belgium vs Alsatian Unemployment Among Women with Children Under 6 years
COMPARE
Immigrants from Belgium
Alsatian
Unemployment Among Women with Children Under 6 years
Unemployment Among Women with Children Under 6 years Comparison
Immigrants from Belgium
Alsatians
6.9%
UNEMPLOYMENT AMONG WOMEN WITH CHILDREN UNDER 6 YEARS
99.6/ 100
METRIC RATING
66th/ 347
METRIC RANK
7.1%
UNEMPLOYMENT AMONG WOMEN WITH CHILDREN UNDER 6 YEARS
98.4/ 100
METRIC RATING
87th/ 347
METRIC RANK
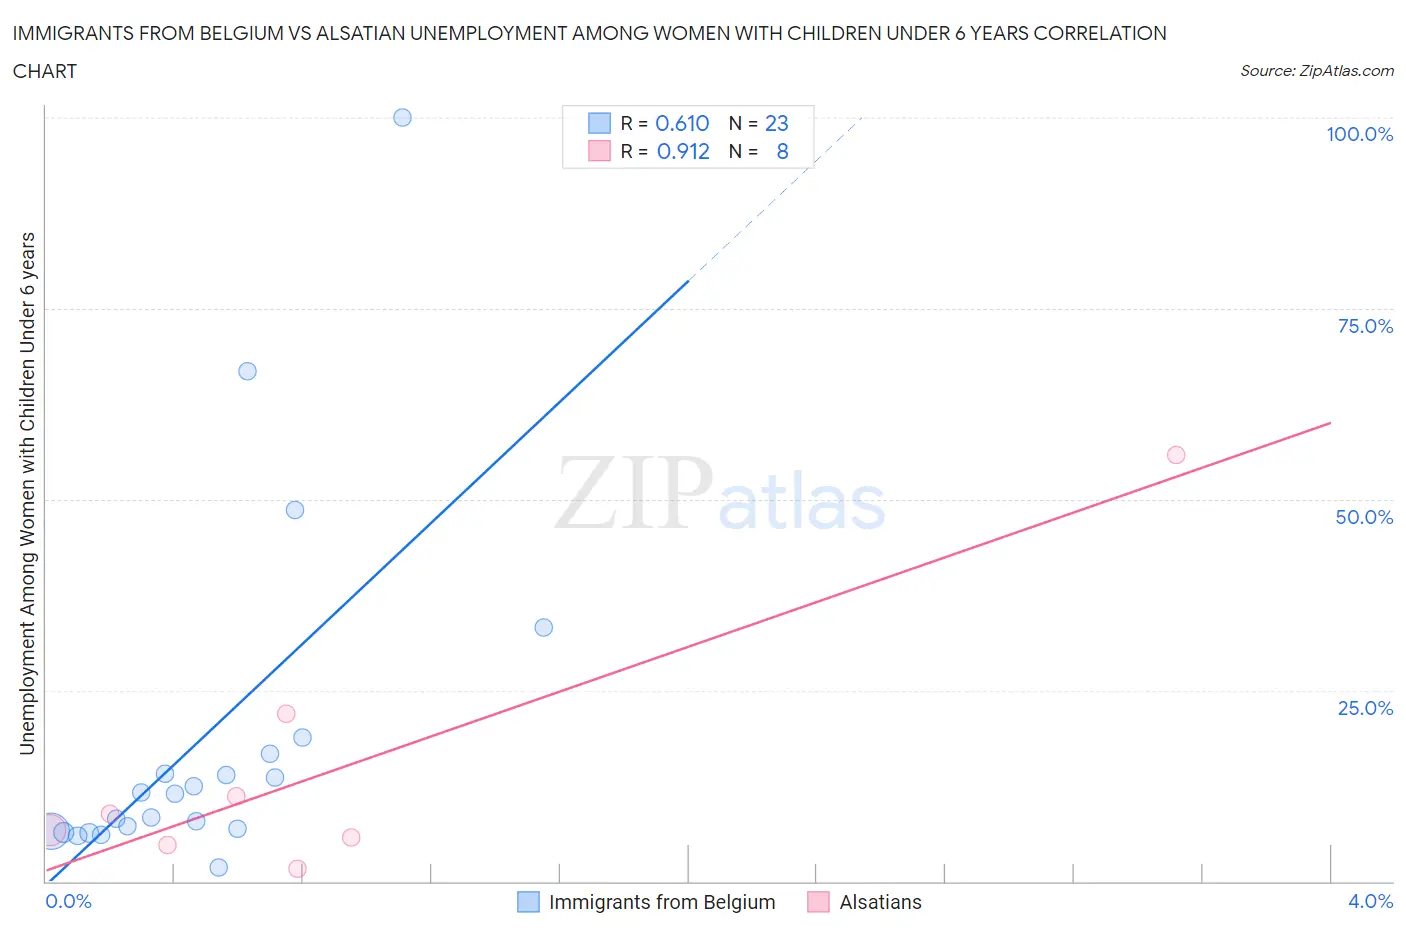
Immigrants from Belgium vs Alsatian Unemployment Among Women with Children Under 6 years Correlation Chart
The statistical analysis conducted on geographies consisting of 126,448,040 people shows a significant positive correlation between the proportion of Immigrants from Belgium and unemployment rate among women with children under the age of 6 in the United States with a correlation coefficient (R) of 0.610 and weighted average of 6.9%. Similarly, the statistical analysis conducted on geographies consisting of 73,942,058 people shows a near-perfect positive correlation between the proportion of Alsatians and unemployment rate among women with children under the age of 6 in the United States with a correlation coefficient (R) of 0.912 and weighted average of 7.1%, a difference of 2.6%.
Unemployment Among Women with Children Under 6 years Correlation Summary
| Measurement | Immigrants from Belgium | Alsatian |
| Minimum | 1.8% | 1.6% |
| Maximum | 100.0% | 55.8% |
| Range | 98.2% | 54.2% |
| Mean | 18.8% | 14.6% |
| Median | 11.4% | 7.7% |
| Interquartile 25% (IQ1) | 6.5% | 5.3% |
| Interquartile 75% (IQ3) | 16.7% | 16.5% |
| Interquartile Range (IQR) | 10.2% | 11.3% |
| Standard Deviation (Sample) | 23.3% | 17.7% |
| Standard Deviation (Population) | 22.7% | 16.6% |
Similar Demographics by Unemployment Among Women with Children Under 6 years
Demographics Similar to Immigrants from Belgium by Unemployment Among Women with Children Under 6 years
In terms of unemployment among women with children under 6 years, the demographic groups most similar to Immigrants from Belgium are Immigrants from Kuwait (6.9%, a difference of 0.22%), Tongan (6.9%, a difference of 0.37%), Immigrants from Netherlands (7.0%, a difference of 0.46%), Maltese (6.9%, a difference of 0.47%), and Somali (6.9%, a difference of 0.52%).
| Demographics | Rating | Rank | Unemployment Among Women with Children Under 6 years |
| Immigrants | Serbia | 99.8 /100 | #59 | Exceptional 6.9% |
| Immigrants | Sri Lanka | 99.8 /100 | #60 | Exceptional 6.9% |
| Immigrants | France | 99.7 /100 | #61 | Exceptional 6.9% |
| Somalis | 99.7 /100 | #62 | Exceptional 6.9% |
| Maltese | 99.7 /100 | #63 | Exceptional 6.9% |
| Tongans | 99.7 /100 | #64 | Exceptional 6.9% |
| Immigrants | Kuwait | 99.7 /100 | #65 | Exceptional 6.9% |
| Immigrants | Belgium | 99.6 /100 | #66 | Exceptional 6.9% |
| Immigrants | Netherlands | 99.5 /100 | #67 | Exceptional 7.0% |
| Paraguayans | 99.4 /100 | #68 | Exceptional 7.0% |
| Immigrants | Eritrea | 99.4 /100 | #69 | Exceptional 7.0% |
| Immigrants | Iraq | 99.4 /100 | #70 | Exceptional 7.0% |
| Afghans | 99.4 /100 | #71 | Exceptional 7.0% |
| Cubans | 99.4 /100 | #72 | Exceptional 7.0% |
| Immigrants | Czechoslovakia | 99.2 /100 | #73 | Exceptional 7.0% |
Demographics Similar to Alsatians by Unemployment Among Women with Children Under 6 years
In terms of unemployment among women with children under 6 years, the demographic groups most similar to Alsatians are Immigrants from Hungary (7.1%, a difference of 0.12%), Immigrants from Zimbabwe (7.1%, a difference of 0.15%), Immigrants from Denmark (7.1%, a difference of 0.16%), Immigrants from Spain (7.1%, a difference of 0.22%), and Immigrants from Romania (7.1%, a difference of 0.28%).
| Demographics | Rating | Rank | Unemployment Among Women with Children Under 6 years |
| Immigrants | Greece | 98.9 /100 | #80 | Exceptional 7.1% |
| Immigrants | Venezuela | 98.8 /100 | #81 | Exceptional 7.1% |
| Immigrants | Afghanistan | 98.7 /100 | #82 | Exceptional 7.1% |
| Egyptians | 98.7 /100 | #83 | Exceptional 7.1% |
| Immigrants | Albania | 98.7 /100 | #84 | Exceptional 7.1% |
| Immigrants | Romania | 98.7 /100 | #85 | Exceptional 7.1% |
| Immigrants | Zimbabwe | 98.6 /100 | #86 | Exceptional 7.1% |
| Alsatians | 98.4 /100 | #87 | Exceptional 7.1% |
| Immigrants | Hungary | 98.3 /100 | #88 | Exceptional 7.1% |
| Immigrants | Denmark | 98.3 /100 | #89 | Exceptional 7.1% |
| Immigrants | Spain | 98.2 /100 | #90 | Exceptional 7.1% |
| Danes | 98.2 /100 | #91 | Exceptional 7.1% |
| Albanians | 98.0 /100 | #92 | Exceptional 7.2% |
| New Zealanders | 97.8 /100 | #93 | Exceptional 7.2% |
| Macedonians | 97.7 /100 | #94 | Exceptional 7.2% |