Immigrants from Belgium vs Cape Verdean Unemployment
COMPARE
Immigrants from Belgium
Cape Verdean
Unemployment
Unemployment Comparison
Immigrants from Belgium
Cape Verdeans
4.9%
UNEMPLOYMENT
99.2/ 100
METRIC RATING
51st/ 347
METRIC RANK
6.5%
UNEMPLOYMENT
0.0/ 100
METRIC RATING
311th/ 347
METRIC RANK
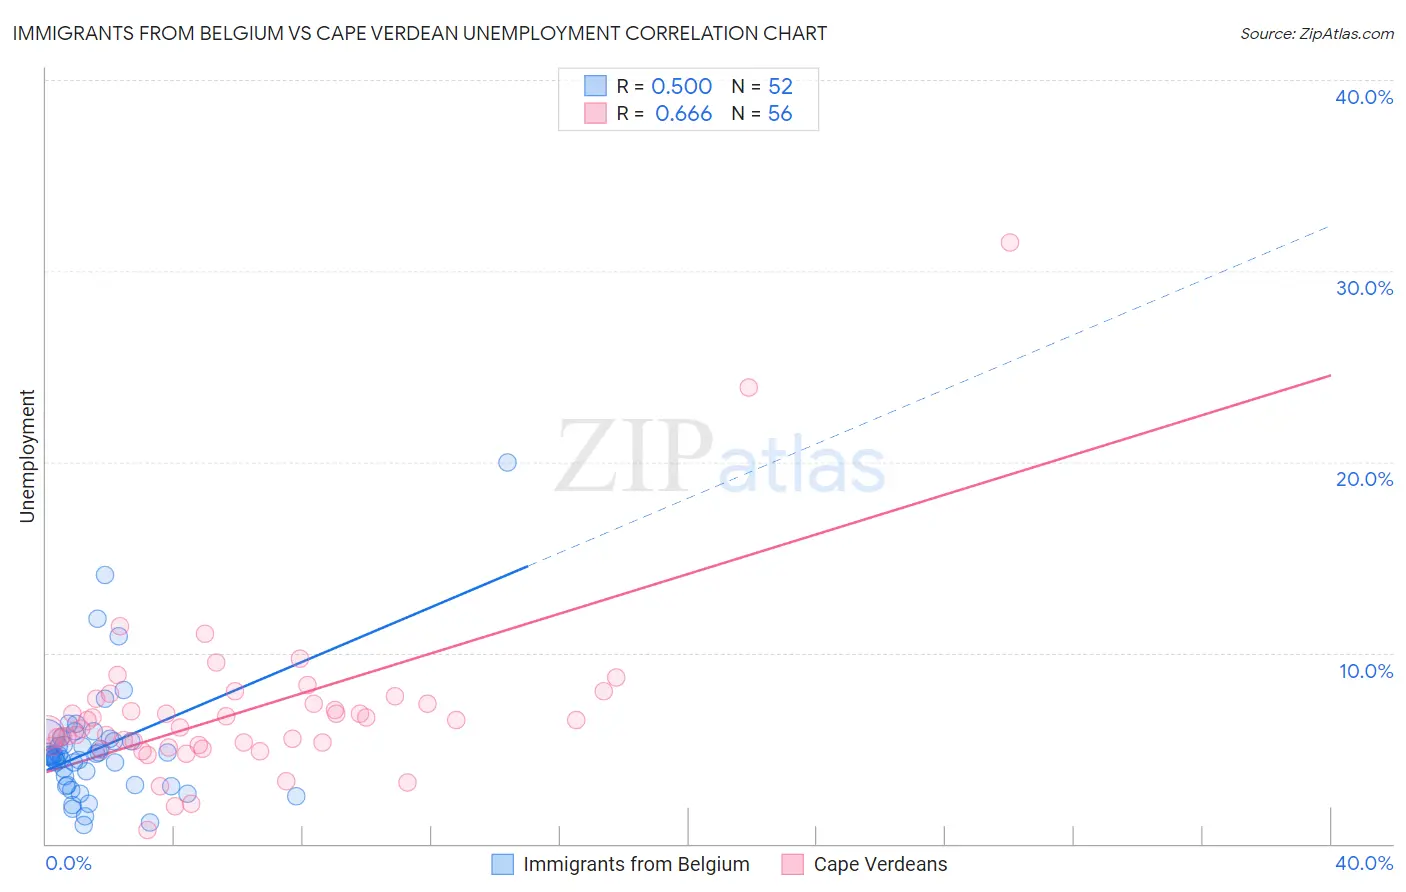
Immigrants from Belgium vs Cape Verdean Unemployment Correlation Chart
The statistical analysis conducted on geographies consisting of 146,688,152 people shows a substantial positive correlation between the proportion of Immigrants from Belgium and unemployment in the United States with a correlation coefficient (R) of 0.500 and weighted average of 4.9%. Similarly, the statistical analysis conducted on geographies consisting of 107,538,461 people shows a significant positive correlation between the proportion of Cape Verdeans and unemployment in the United States with a correlation coefficient (R) of 0.666 and weighted average of 6.5%, a difference of 34.3%.
Unemployment Correlation Summary
| Measurement | Immigrants from Belgium | Cape Verdean |
| Minimum | 1.0% | 0.70% |
| Maximum | 20.0% | 31.5% |
| Range | 19.0% | 30.8% |
| Mean | 5.0% | 6.9% |
| Median | 4.6% | 6.3% |
| Interquartile 25% (IQ1) | 3.1% | 5.1% |
| Interquartile 75% (IQ3) | 5.4% | 7.5% |
| Interquartile Range (IQR) | 2.3% | 2.3% |
| Standard Deviation (Sample) | 3.2% | 4.6% |
| Standard Deviation (Population) | 3.2% | 4.5% |
Similar Demographics by Unemployment
Demographics Similar to Immigrants from Belgium by Unemployment
In terms of unemployment, the demographic groups most similar to Immigrants from Belgium are White/Caucasian (4.9%, a difference of 0.010%), Immigrants from Zimbabwe (4.9%, a difference of 0.040%), Eastern European (4.9%, a difference of 0.070%), Australian (4.9%, a difference of 0.10%), and French Canadian (4.9%, a difference of 0.16%).
| Demographics | Rating | Rank | Unemployment |
| Austrians | 99.5 /100 | #44 | Exceptional 4.8% |
| French | 99.5 /100 | #45 | Exceptional 4.8% |
| Immigrants | Nepal | 99.4 /100 | #46 | Exceptional 4.8% |
| Immigrants | Taiwan | 99.4 /100 | #47 | Exceptional 4.8% |
| Immigrants | Scotland | 99.3 /100 | #48 | Exceptional 4.9% |
| Immigrants | South Central Asia | 99.3 /100 | #49 | Exceptional 4.9% |
| French Canadians | 99.3 /100 | #50 | Exceptional 4.9% |
| Immigrants | Belgium | 99.2 /100 | #51 | Exceptional 4.9% |
| Whites/Caucasians | 99.2 /100 | #52 | Exceptional 4.9% |
| Immigrants | Zimbabwe | 99.2 /100 | #53 | Exceptional 4.9% |
| Eastern Europeans | 99.2 /100 | #54 | Exceptional 4.9% |
| Australians | 99.2 /100 | #55 | Exceptional 4.9% |
| Celtics | 99.1 /100 | #56 | Exceptional 4.9% |
| Immigrants | Singapore | 99.1 /100 | #57 | Exceptional 4.9% |
| Greeks | 99.0 /100 | #58 | Exceptional 4.9% |
Demographics Similar to Cape Verdeans by Unemployment
In terms of unemployment, the demographic groups most similar to Cape Verdeans are Immigrants from Belize (6.5%, a difference of 0.33%), Colville (6.6%, a difference of 0.57%), Vietnamese (6.5%, a difference of 0.60%), Barbadian (6.5%, a difference of 0.61%), and Immigrants from Barbados (6.6%, a difference of 0.95%).
| Demographics | Rating | Rank | Unemployment |
| Immigrants | Jamaica | 0.0 /100 | #304 | Tragic 6.4% |
| Menominee | 0.0 /100 | #305 | Tragic 6.4% |
| Lumbee | 0.0 /100 | #306 | Tragic 6.4% |
| Immigrants | Bangladesh | 0.0 /100 | #307 | Tragic 6.5% |
| Barbadians | 0.0 /100 | #308 | Tragic 6.5% |
| Vietnamese | 0.0 /100 | #309 | Tragic 6.5% |
| Immigrants | Belize | 0.0 /100 | #310 | Tragic 6.5% |
| Cape Verdeans | 0.0 /100 | #311 | Tragic 6.5% |
| Colville | 0.0 /100 | #312 | Tragic 6.6% |
| Immigrants | Barbados | 0.0 /100 | #313 | Tragic 6.6% |
| Blacks/African Americans | 0.0 /100 | #314 | Tragic 6.6% |
| Houma | 0.0 /100 | #315 | Tragic 6.7% |
| Immigrants | Dominica | 0.0 /100 | #316 | Tragic 6.7% |
| Shoshone | 0.0 /100 | #317 | Tragic 6.8% |
| Immigrants | Cabo Verde | 0.0 /100 | #318 | Tragic 6.8% |