Immigrants from Bolivia vs Inupiat Unemployment Among Ages 16 to 19 years
COMPARE
Immigrants from Bolivia
Inupiat
Unemployment Among Ages 16 to 19 years
Unemployment Among Ages 16 to 19 years Comparison
Immigrants from Bolivia
Inupiat
17.2%
UNEMPLOYMENT AMONG AGES 16 TO 19 YEARS
86.7/ 100
METRIC RATING
126th/ 347
METRIC RANK
28.1%
UNEMPLOYMENT AMONG AGES 16 TO 19 YEARS
0.0/ 100
METRIC RATING
342nd/ 347
METRIC RANK
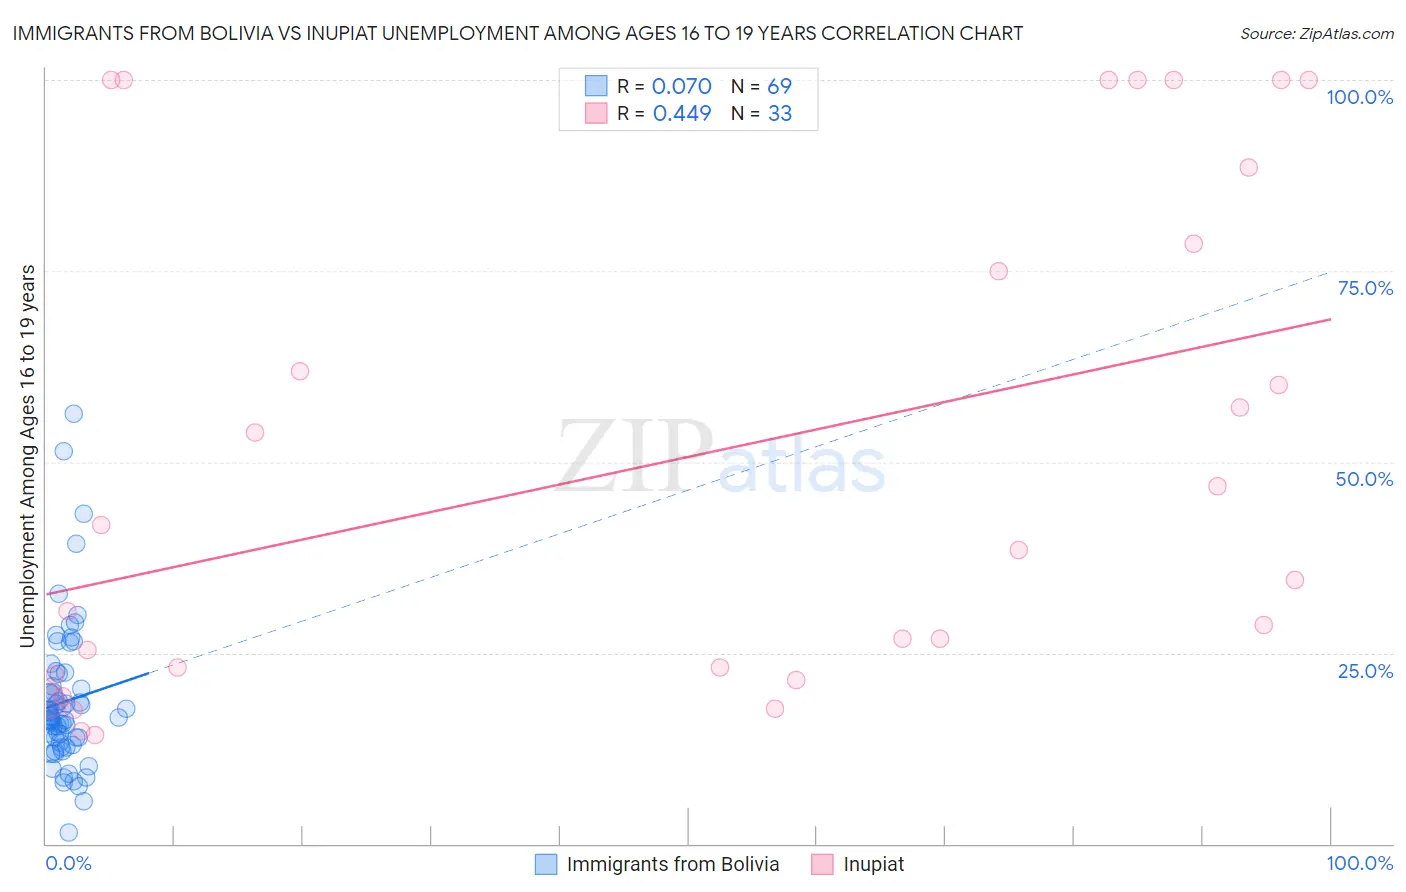
Immigrants from Bolivia vs Inupiat Unemployment Among Ages 16 to 19 years Correlation Chart
The statistical analysis conducted on geographies consisting of 155,284,725 people shows a slight positive correlation between the proportion of Immigrants from Bolivia and unemployment rate among population between the ages 16 and 19 in the United States with a correlation coefficient (R) of 0.070 and weighted average of 17.2%. Similarly, the statistical analysis conducted on geographies consisting of 94,709,407 people shows a moderate positive correlation between the proportion of Inupiat and unemployment rate among population between the ages 16 and 19 in the United States with a correlation coefficient (R) of 0.449 and weighted average of 28.1%, a difference of 63.2%.
Unemployment Among Ages 16 to 19 years Correlation Summary
| Measurement | Immigrants from Bolivia | Inupiat |
| Minimum | 1.4% | 14.3% |
| Maximum | 56.3% | 100.0% |
| Range | 54.9% | 85.7% |
| Mean | 18.6% | 50.5% |
| Median | 16.6% | 38.5% |
| Interquartile 25% (IQ1) | 13.2% | 22.5% |
| Interquartile 75% (IQ3) | 21.4% | 83.6% |
| Interquartile Range (IQR) | 8.3% | 61.1% |
| Standard Deviation (Sample) | 9.6% | 32.3% |
| Standard Deviation (Population) | 9.5% | 31.8% |
Similar Demographics by Unemployment Among Ages 16 to 19 years
Demographics Similar to Immigrants from Bolivia by Unemployment Among Ages 16 to 19 years
In terms of unemployment among ages 16 to 19 years, the demographic groups most similar to Immigrants from Bolivia are Immigrants from Germany (17.2%, a difference of 0.10%), Pakistani (17.2%, a difference of 0.10%), Australian (17.2%, a difference of 0.12%), Creek (17.2%, a difference of 0.13%), and Immigrants from Indonesia (17.2%, a difference of 0.20%).
| Demographics | Rating | Rank | Unemployment Among Ages 16 to 19 years |
| Hungarians | 91.6 /100 | #119 | Exceptional 17.1% |
| Immigrants | Middle Africa | 90.9 /100 | #120 | Exceptional 17.1% |
| Immigrants | Moldova | 90.7 /100 | #121 | Exceptional 17.1% |
| Immigrants | South Eastern Asia | 90.7 /100 | #122 | Exceptional 17.1% |
| Immigrants | Laos | 88.8 /100 | #123 | Excellent 17.1% |
| Syrians | 88.6 /100 | #124 | Excellent 17.1% |
| Immigrants | Germany | 87.7 /100 | #125 | Excellent 17.2% |
| Immigrants | Bolivia | 86.7 /100 | #126 | Excellent 17.2% |
| Pakistanis | 85.8 /100 | #127 | Excellent 17.2% |
| Australians | 85.6 /100 | #128 | Excellent 17.2% |
| Creek | 85.5 /100 | #129 | Excellent 17.2% |
| Immigrants | Indonesia | 84.7 /100 | #130 | Excellent 17.2% |
| German Russians | 84.1 /100 | #131 | Excellent 17.2% |
| Arabs | 83.9 /100 | #132 | Excellent 17.2% |
| Laotians | 83.9 /100 | #133 | Excellent 17.2% |
Demographics Similar to Inupiat by Unemployment Among Ages 16 to 19 years
In terms of unemployment among ages 16 to 19 years, the demographic groups most similar to Inupiat are Puerto Rican (27.5%, a difference of 2.0%), Navajo (29.0%, a difference of 3.5%), Colville (29.7%, a difference of 5.8%), Crow (26.2%, a difference of 6.9%), and Immigrants from Grenada (25.7%, a difference of 9.0%).
| Demographics | Rating | Rank | Unemployment Among Ages 16 to 19 years |
| Paiute | 0.0 /100 | #333 | Tragic 24.4% |
| Guyanese | 0.0 /100 | #334 | Tragic 24.8% |
| Arapaho | 0.0 /100 | #335 | Tragic 25.2% |
| Kiowa | 0.0 /100 | #336 | Tragic 25.2% |
| Immigrants | Guyana | 0.0 /100 | #337 | Tragic 25.5% |
| Immigrants | St. Vincent and the Grenadines | 0.0 /100 | #338 | Tragic 25.7% |
| Immigrants | Grenada | 0.0 /100 | #339 | Tragic 25.7% |
| Crow | 0.0 /100 | #340 | Tragic 26.2% |
| Puerto Ricans | 0.0 /100 | #341 | Tragic 27.5% |
| Inupiat | 0.0 /100 | #342 | Tragic 28.1% |
| Navajo | 0.0 /100 | #343 | Tragic 29.0% |
| Colville | 0.0 /100 | #344 | Tragic 29.7% |
| Hopi | 0.0 /100 | #345 | Tragic 30.7% |
| Yuman | 0.0 /100 | #346 | Tragic 37.4% |
| Yup'ik | 0.0 /100 | #347 | Tragic 41.0% |