Immigrants from Belarus vs Immigrants from South Central Asia Unemployment Among Ages 16 to 19 years
COMPARE
Immigrants from Belarus
Immigrants from South Central Asia
Unemployment Among Ages 16 to 19 years
Unemployment Among Ages 16 to 19 years Comparison
Immigrants from Belarus
Immigrants from South Central Asia
18.6%
UNEMPLOYMENT AMONG AGES 16 TO 19 YEARS
0.8/ 100
METRIC RATING
245th/ 347
METRIC RANK
16.2%
UNEMPLOYMENT AMONG AGES 16 TO 19 YEARS
99.8/ 100
METRIC RATING
36th/ 347
METRIC RANK
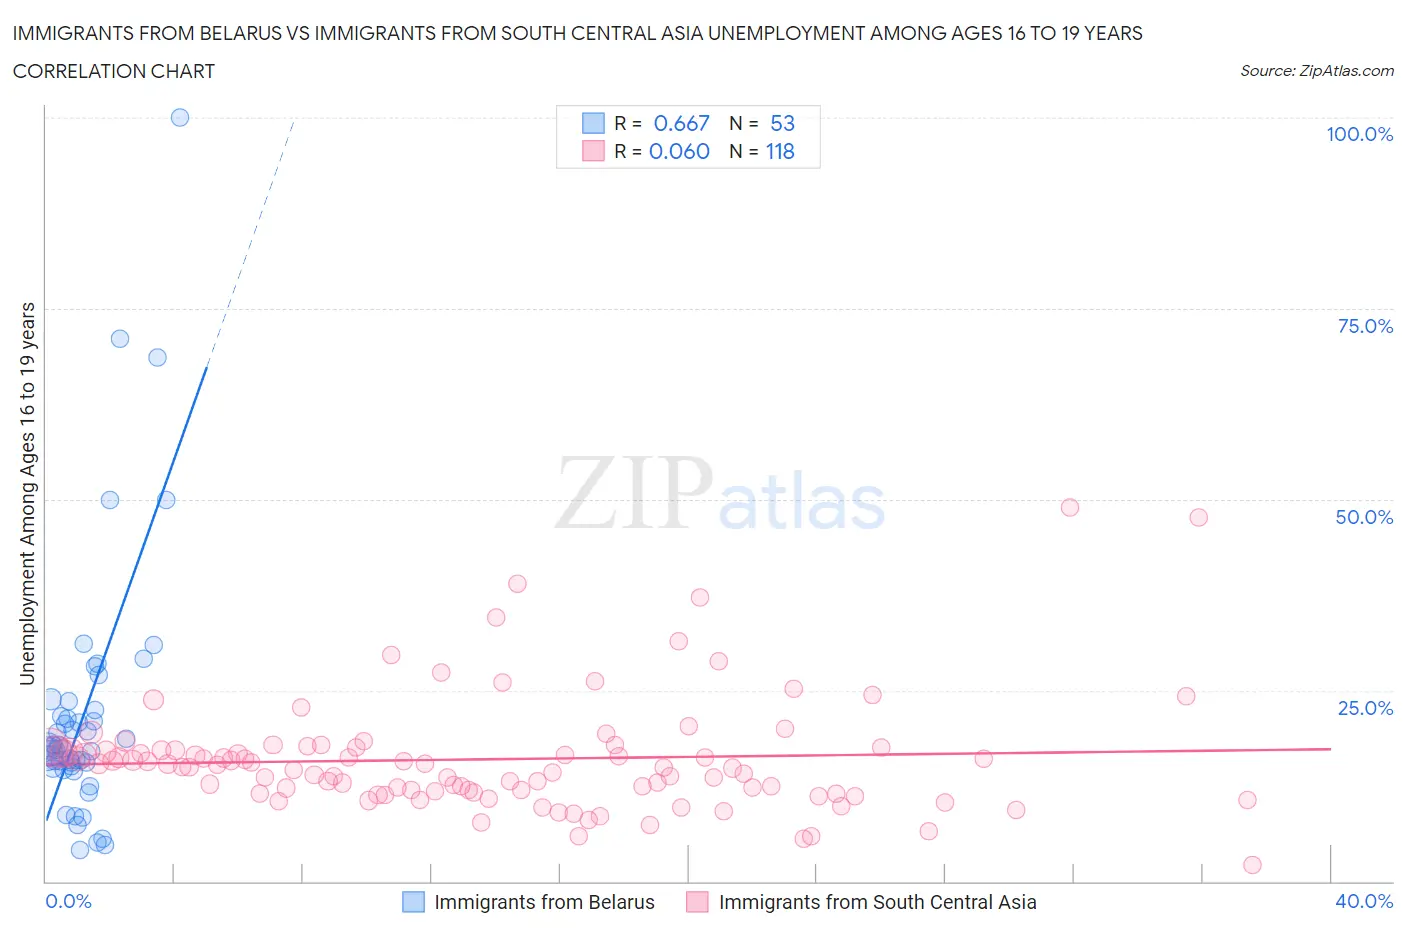
Immigrants from Belarus vs Immigrants from South Central Asia Unemployment Among Ages 16 to 19 years Correlation Chart
The statistical analysis conducted on geographies consisting of 145,960,072 people shows a significant positive correlation between the proportion of Immigrants from Belarus and unemployment rate among population between the ages 16 and 19 in the United States with a correlation coefficient (R) of 0.667 and weighted average of 18.6%. Similarly, the statistical analysis conducted on geographies consisting of 443,198,264 people shows a slight positive correlation between the proportion of Immigrants from South Central Asia and unemployment rate among population between the ages 16 and 19 in the United States with a correlation coefficient (R) of 0.060 and weighted average of 16.2%, a difference of 14.4%.
Unemployment Among Ages 16 to 19 years Correlation Summary
| Measurement | Immigrants from Belarus | Immigrants from South Central Asia |
| Minimum | 4.1% | 2.2% |
| Maximum | 100.0% | 48.9% |
| Range | 95.9% | 46.7% |
| Mean | 22.0% | 16.0% |
| Median | 17.4% | 15.1% |
| Interquartile 25% (IQ1) | 14.9% | 11.9% |
| Interquartile 75% (IQ3) | 23.1% | 17.1% |
| Interquartile Range (IQR) | 8.1% | 5.3% |
| Standard Deviation (Sample) | 17.2% | 7.5% |
| Standard Deviation (Population) | 17.0% | 7.4% |
Similar Demographics by Unemployment Among Ages 16 to 19 years
Demographics Similar to Immigrants from Belarus by Unemployment Among Ages 16 to 19 years
In terms of unemployment among ages 16 to 19 years, the demographic groups most similar to Immigrants from Belarus are Guatemalan (18.6%, a difference of 0.010%), Mexican (18.5%, a difference of 0.22%), Moroccan (18.5%, a difference of 0.38%), Immigrants from South America (18.7%, a difference of 0.42%), and Immigrants from Israel (18.7%, a difference of 0.47%).
| Demographics | Rating | Rank | Unemployment Among Ages 16 to 19 years |
| South Americans | 2.6 /100 | #238 | Tragic 18.3% |
| Native Hawaiians | 2.4 /100 | #239 | Tragic 18.3% |
| Immigrants | Cabo Verde | 2.0 /100 | #240 | Tragic 18.4% |
| Immigrants | Ukraine | 1.3 /100 | #241 | Tragic 18.5% |
| Moroccans | 1.1 /100 | #242 | Tragic 18.5% |
| Mexicans | 0.9 /100 | #243 | Tragic 18.5% |
| Guatemalans | 0.8 /100 | #244 | Tragic 18.6% |
| Immigrants | Belarus | 0.8 /100 | #245 | Tragic 18.6% |
| Immigrants | South America | 0.5 /100 | #246 | Tragic 18.7% |
| Immigrants | Israel | 0.5 /100 | #247 | Tragic 18.7% |
| Delaware | 0.5 /100 | #248 | Tragic 18.7% |
| Puget Sound Salish | 0.5 /100 | #249 | Tragic 18.7% |
| Panamanians | 0.4 /100 | #250 | Tragic 18.7% |
| Sub-Saharan Africans | 0.4 /100 | #251 | Tragic 18.7% |
| Immigrants | Guatemala | 0.4 /100 | #252 | Tragic 18.7% |
Demographics Similar to Immigrants from South Central Asia by Unemployment Among Ages 16 to 19 years
In terms of unemployment among ages 16 to 19 years, the demographic groups most similar to Immigrants from South Central Asia are Scottish (16.2%, a difference of 0.010%), Immigrants from Congo (16.3%, a difference of 0.10%), Bulgarian (16.3%, a difference of 0.12%), Pennsylvania German (16.2%, a difference of 0.16%), and Immigrants from Kenya (16.2%, a difference of 0.19%).
| Demographics | Rating | Rank | Unemployment Among Ages 16 to 19 years |
| Chinese | 99.9 /100 | #29 | Exceptional 16.0% |
| Kenyans | 99.9 /100 | #30 | Exceptional 16.1% |
| English | 99.9 /100 | #31 | Exceptional 16.1% |
| Europeans | 99.9 /100 | #32 | Exceptional 16.1% |
| Immigrants | Kenya | 99.9 /100 | #33 | Exceptional 16.2% |
| Pennsylvania Germans | 99.9 /100 | #34 | Exceptional 16.2% |
| Scottish | 99.8 /100 | #35 | Exceptional 16.2% |
| Immigrants | South Central Asia | 99.8 /100 | #36 | Exceptional 16.2% |
| Immigrants | Congo | 99.8 /100 | #37 | Exceptional 16.3% |
| Bulgarians | 99.8 /100 | #38 | Exceptional 16.3% |
| Croatians | 99.8 /100 | #39 | Exceptional 16.3% |
| Hmong | 99.8 /100 | #40 | Exceptional 16.3% |
| Immigrants | Nepal | 99.8 /100 | #41 | Exceptional 16.3% |
| Fijians | 99.8 /100 | #42 | Exceptional 16.3% |
| Immigrants | Lebanon | 99.8 /100 | #43 | Exceptional 16.3% |