Immigrants from Belarus vs Carpatho Rusyn Unemployment Among Ages 45 to 54 years
COMPARE
Immigrants from Belarus
Carpatho Rusyn
Unemployment Among Ages 45 to 54 years
Unemployment Among Ages 45 to 54 years Comparison
Immigrants from Belarus
Carpatho Rusyns
4.6%
UNEMPLOYMENT AMONG AGES 45 TO 54 YEARS
30.6/ 100
METRIC RATING
198th/ 347
METRIC RANK
4.1%
UNEMPLOYMENT AMONG AGES 45 TO 54 YEARS
100.0/ 100
METRIC RATING
24th/ 347
METRIC RANK
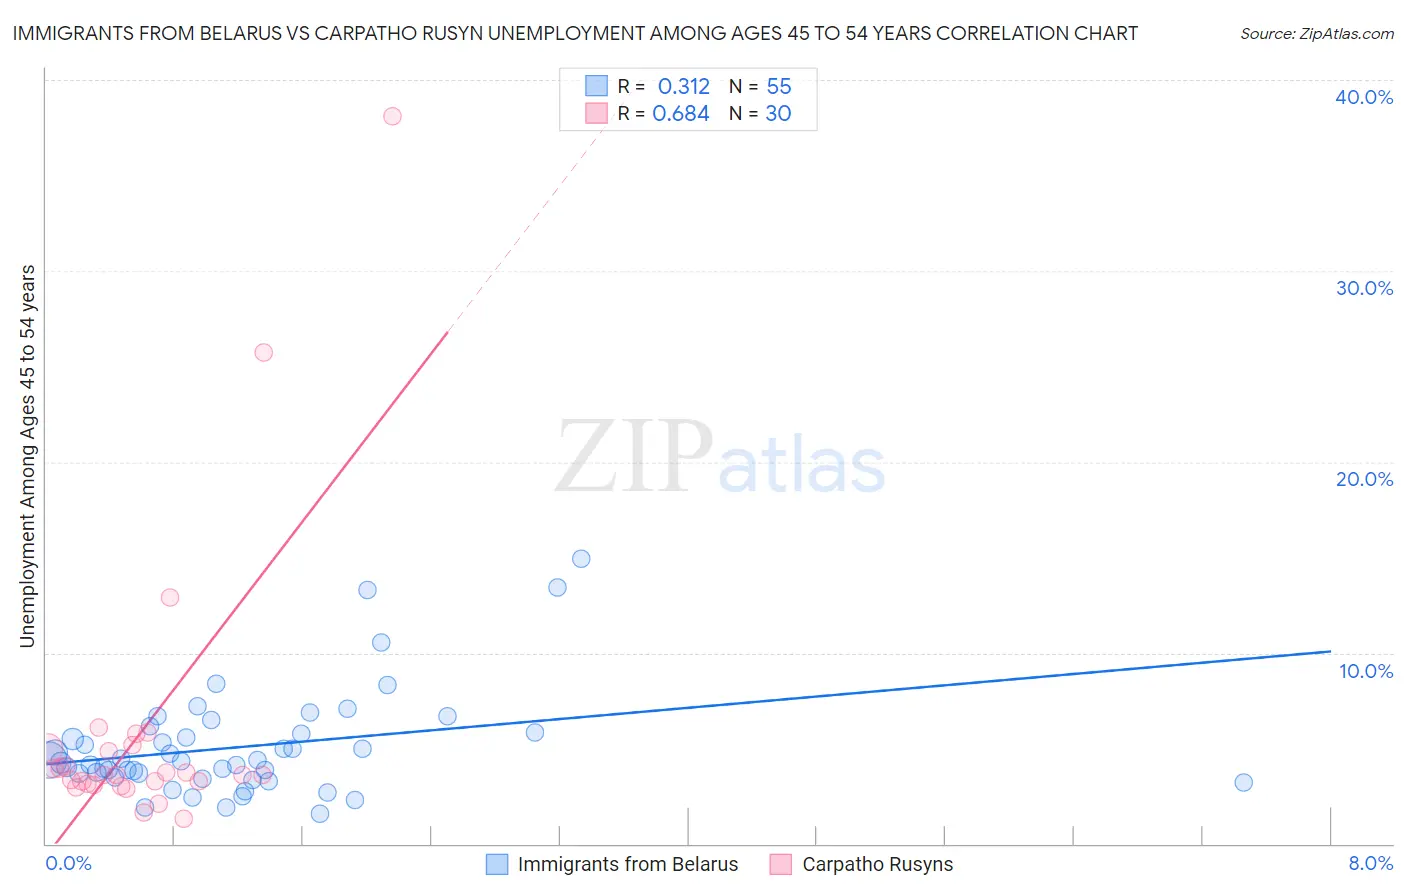
Immigrants from Belarus vs Carpatho Rusyn Unemployment Among Ages 45 to 54 years Correlation Chart
The statistical analysis conducted on geographies consisting of 148,948,827 people shows a mild positive correlation between the proportion of Immigrants from Belarus and unemployment rate among population between the ages 45 and 54 in the United States with a correlation coefficient (R) of 0.312 and weighted average of 4.6%. Similarly, the statistical analysis conducted on geographies consisting of 58,336,549 people shows a significant positive correlation between the proportion of Carpatho Rusyns and unemployment rate among population between the ages 45 and 54 in the United States with a correlation coefficient (R) of 0.684 and weighted average of 4.1%, a difference of 10.9%.
Unemployment Among Ages 45 to 54 years Correlation Summary
| Measurement | Immigrants from Belarus | Carpatho Rusyn |
| Minimum | 1.6% | 1.3% |
| Maximum | 14.9% | 38.1% |
| Range | 13.3% | 36.8% |
| Mean | 5.1% | 5.9% |
| Median | 4.3% | 3.6% |
| Interquartile 25% (IQ1) | 3.5% | 3.2% |
| Interquartile 75% (IQ3) | 5.8% | 5.0% |
| Interquartile Range (IQR) | 2.3% | 1.8% |
| Standard Deviation (Sample) | 2.8% | 7.5% |
| Standard Deviation (Population) | 2.7% | 7.4% |
Similar Demographics by Unemployment Among Ages 45 to 54 years
Demographics Similar to Immigrants from Belarus by Unemployment Among Ages 45 to 54 years
In terms of unemployment among ages 45 to 54 years, the demographic groups most similar to Immigrants from Belarus are Albanian (4.6%, a difference of 0.020%), Estonian (4.6%, a difference of 0.030%), Peruvian (4.6%, a difference of 0.050%), South American (4.6%, a difference of 0.12%), and Immigrants from Lithuania (4.6%, a difference of 0.14%).
| Demographics | Rating | Rank | Unemployment Among Ages 45 to 54 years |
| Immigrants | Uruguay | 34.4 /100 | #191 | Fair 4.6% |
| Immigrants | Thailand | 34.1 /100 | #192 | Fair 4.6% |
| Immigrants | Lithuania | 33.2 /100 | #193 | Fair 4.6% |
| South Americans | 32.9 /100 | #194 | Fair 4.6% |
| Peruvians | 31.5 /100 | #195 | Fair 4.6% |
| Estonians | 31.2 /100 | #196 | Fair 4.6% |
| Albanians | 31.1 /100 | #197 | Fair 4.6% |
| Immigrants | Belarus | 30.6 /100 | #198 | Fair 4.6% |
| Brazilians | 20.1 /100 | #199 | Fair 4.6% |
| Immigrants | Denmark | 19.8 /100 | #200 | Poor 4.6% |
| Immigrants | Costa Rica | 19.7 /100 | #201 | Poor 4.6% |
| Immigrants | Peru | 19.1 /100 | #202 | Poor 4.6% |
| Liberians | 18.7 /100 | #203 | Poor 4.6% |
| Immigrants | Morocco | 16.8 /100 | #204 | Poor 4.6% |
| Immigrants | Greece | 16.2 /100 | #205 | Poor 4.6% |
Demographics Similar to Carpatho Rusyns by Unemployment Among Ages 45 to 54 years
In terms of unemployment among ages 45 to 54 years, the demographic groups most similar to Carpatho Rusyns are Bolivian (4.1%, a difference of 0.12%), Scottish (4.1%, a difference of 0.12%), Immigrants from Moldova (4.1%, a difference of 0.60%), Bulgarian (4.1%, a difference of 0.65%), and Yugoslavian (4.1%, a difference of 0.66%).
| Demographics | Rating | Rank | Unemployment Among Ages 45 to 54 years |
| Tongans | 100.0 /100 | #17 | Exceptional 4.1% |
| Germans | 100.0 /100 | #18 | Exceptional 4.1% |
| Swiss | 100.0 /100 | #19 | Exceptional 4.1% |
| English | 100.0 /100 | #20 | Exceptional 4.1% |
| Europeans | 100.0 /100 | #21 | Exceptional 4.1% |
| Yugoslavians | 100.0 /100 | #22 | Exceptional 4.1% |
| Bulgarians | 100.0 /100 | #23 | Exceptional 4.1% |
| Carpatho Rusyns | 100.0 /100 | #24 | Exceptional 4.1% |
| Bolivians | 99.9 /100 | #25 | Exceptional 4.1% |
| Scottish | 99.9 /100 | #26 | Exceptional 4.1% |
| Immigrants | Moldova | 99.9 /100 | #27 | Exceptional 4.1% |
| Welsh | 99.9 /100 | #28 | Exceptional 4.1% |
| Belgians | 99.9 /100 | #29 | Exceptional 4.1% |
| British | 99.9 /100 | #30 | Exceptional 4.1% |
| Bhutanese | 99.9 /100 | #31 | Exceptional 4.2% |