Immigrants from Barbados vs Immigrants from Serbia Male Unemployment
COMPARE
Immigrants from Barbados
Immigrants from Serbia
Male Unemployment
Male Unemployment Comparison
Immigrants from Barbados
Immigrants from Serbia
7.1%
MALE UNEMPLOYMENT
0.0/ 100
METRIC RATING
314th/ 347
METRIC RANK
5.1%
MALE UNEMPLOYMENT
94.2/ 100
METRIC RATING
93rd/ 347
METRIC RANK
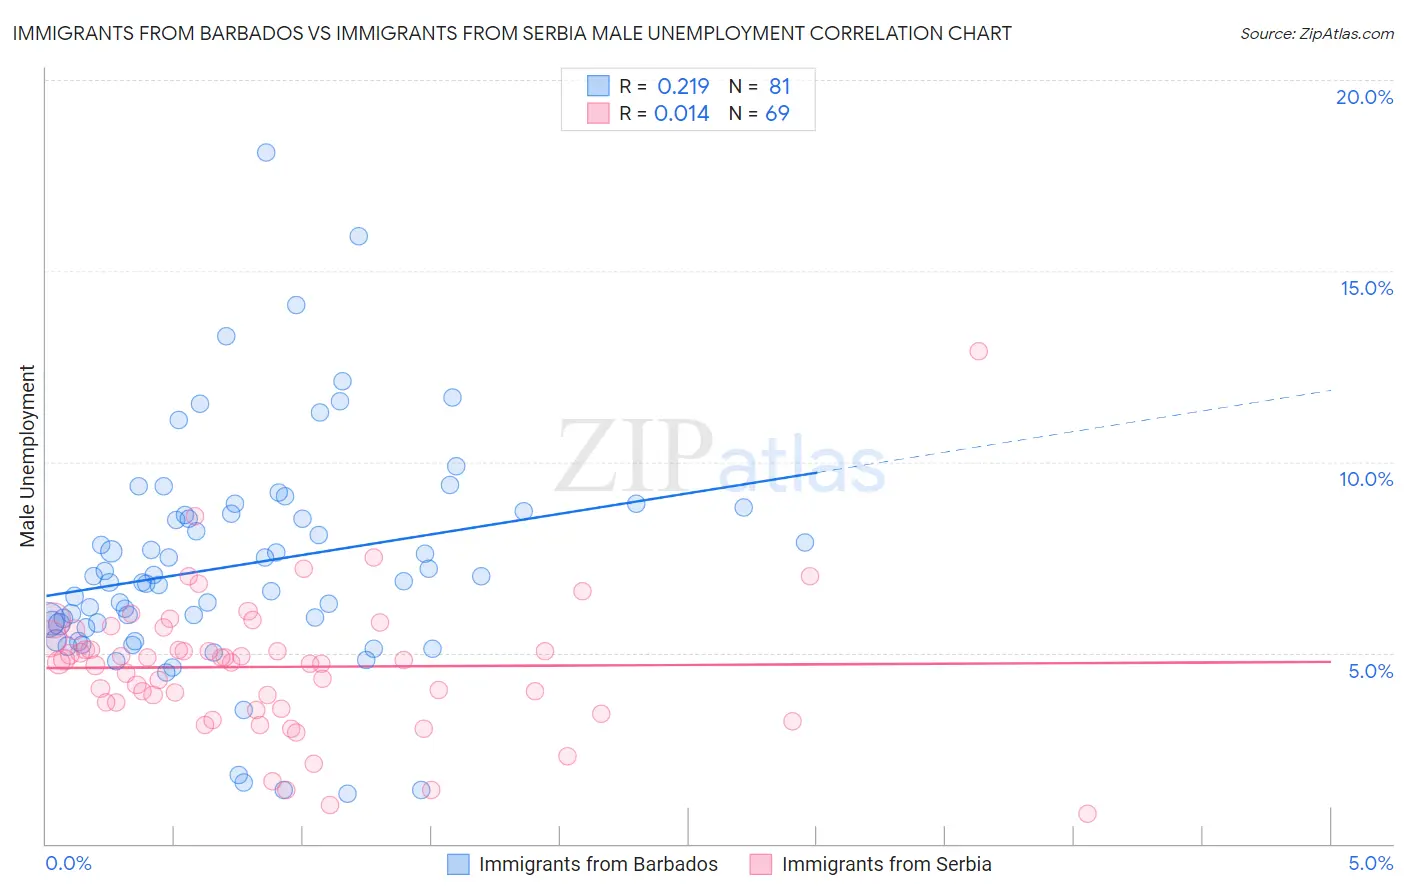
Immigrants from Barbados vs Immigrants from Serbia Male Unemployment Correlation Chart
The statistical analysis conducted on geographies consisting of 112,710,362 people shows a weak positive correlation between the proportion of Immigrants from Barbados and unemployment rate among males in the United States with a correlation coefficient (R) of 0.219 and weighted average of 7.1%. Similarly, the statistical analysis conducted on geographies consisting of 131,612,227 people shows no correlation between the proportion of Immigrants from Serbia and unemployment rate among males in the United States with a correlation coefficient (R) of 0.014 and weighted average of 5.1%, a difference of 39.7%.
Male Unemployment Correlation Summary
| Measurement | Immigrants from Barbados | Immigrants from Serbia |
| Minimum | 1.3% | 0.80% |
| Maximum | 18.1% | 12.9% |
| Range | 16.8% | 12.1% |
| Mean | 7.3% | 4.6% |
| Median | 6.9% | 4.8% |
| Interquartile 25% (IQ1) | 5.7% | 3.6% |
| Interquartile 75% (IQ3) | 8.7% | 5.5% |
| Interquartile Range (IQR) | 3.0% | 1.9% |
| Standard Deviation (Sample) | 3.0% | 1.8% |
| Standard Deviation (Population) | 3.0% | 1.8% |
Similar Demographics by Male Unemployment
Demographics Similar to Immigrants from Barbados by Male Unemployment
In terms of male unemployment, the demographic groups most similar to Immigrants from Barbados are Houma (7.1%, a difference of 0.21%), Immigrants from Guyana (7.1%, a difference of 0.24%), Guyanese (7.1%, a difference of 0.30%), Cape Verdean (7.1%, a difference of 0.36%), and Immigrants from Dominica (7.0%, a difference of 1.3%).
| Demographics | Rating | Rank | Male Unemployment |
| Immigrants | Jamaica | 0.0 /100 | #307 | Tragic 6.7% |
| Aleuts | 0.0 /100 | #308 | Tragic 6.8% |
| Barbadians | 0.0 /100 | #309 | Tragic 6.9% |
| Blacks/African Americans | 0.0 /100 | #310 | Tragic 6.9% |
| Immigrants | Armenia | 0.0 /100 | #311 | Tragic 6.9% |
| Lumbee | 0.0 /100 | #312 | Tragic 6.9% |
| Immigrants | Dominica | 0.0 /100 | #313 | Tragic 7.0% |
| Immigrants | Barbados | 0.0 /100 | #314 | Tragic 7.1% |
| Houma | 0.0 /100 | #315 | Tragic 7.1% |
| Immigrants | Guyana | 0.0 /100 | #316 | Tragic 7.1% |
| Guyanese | 0.0 /100 | #317 | Tragic 7.1% |
| Cape Verdeans | 0.0 /100 | #318 | Tragic 7.1% |
| British West Indians | 0.0 /100 | #319 | Tragic 7.3% |
| Colville | 0.0 /100 | #320 | Tragic 7.4% |
| Immigrants | St. Vincent and the Grenadines | 0.0 /100 | #321 | Tragic 7.5% |
Demographics Similar to Immigrants from Serbia by Male Unemployment
In terms of male unemployment, the demographic groups most similar to Immigrants from Serbia are Slavic (5.1%, a difference of 0.0%), Canadian (5.1%, a difference of 0.050%), Immigrants from Turkey (5.1%, a difference of 0.060%), Italian (5.1%, a difference of 0.12%), and Okinawan (5.1%, a difference of 0.14%).
| Demographics | Rating | Rank | Male Unemployment |
| Maltese | 95.5 /100 | #86 | Exceptional 5.1% |
| Immigrants | Romania | 95.4 /100 | #87 | Exceptional 5.1% |
| Immigrants | Sri Lanka | 94.9 /100 | #88 | Exceptional 5.1% |
| Immigrants | Australia | 94.7 /100 | #89 | Exceptional 5.1% |
| Okinawans | 94.7 /100 | #90 | Exceptional 5.1% |
| Immigrants | Turkey | 94.4 /100 | #91 | Exceptional 5.1% |
| Slavs | 94.2 /100 | #92 | Exceptional 5.1% |
| Immigrants | Serbia | 94.2 /100 | #93 | Exceptional 5.1% |
| Canadians | 94.1 /100 | #94 | Exceptional 5.1% |
| Italians | 93.8 /100 | #95 | Exceptional 5.1% |
| Asians | 93.7 /100 | #96 | Exceptional 5.1% |
| Immigrants | Spain | 93.4 /100 | #97 | Exceptional 5.1% |
| Immigrants | Kuwait | 93.3 /100 | #98 | Exceptional 5.1% |
| Uruguayans | 93.0 /100 | #99 | Exceptional 5.1% |
| Russians | 92.9 /100 | #100 | Exceptional 5.1% |