Immigrants from Bahamas vs Immigrants from Mexico Unemployment
COMPARE
Immigrants from Bahamas
Immigrants from Mexico
Unemployment
Unemployment Comparison
Immigrants from Bahamas
Immigrants from Mexico
5.8%
UNEMPLOYMENT
0.1/ 100
METRIC RATING
258th/ 347
METRIC RANK
6.0%
UNEMPLOYMENT
0.0/ 100
METRIC RATING
279th/ 347
METRIC RANK
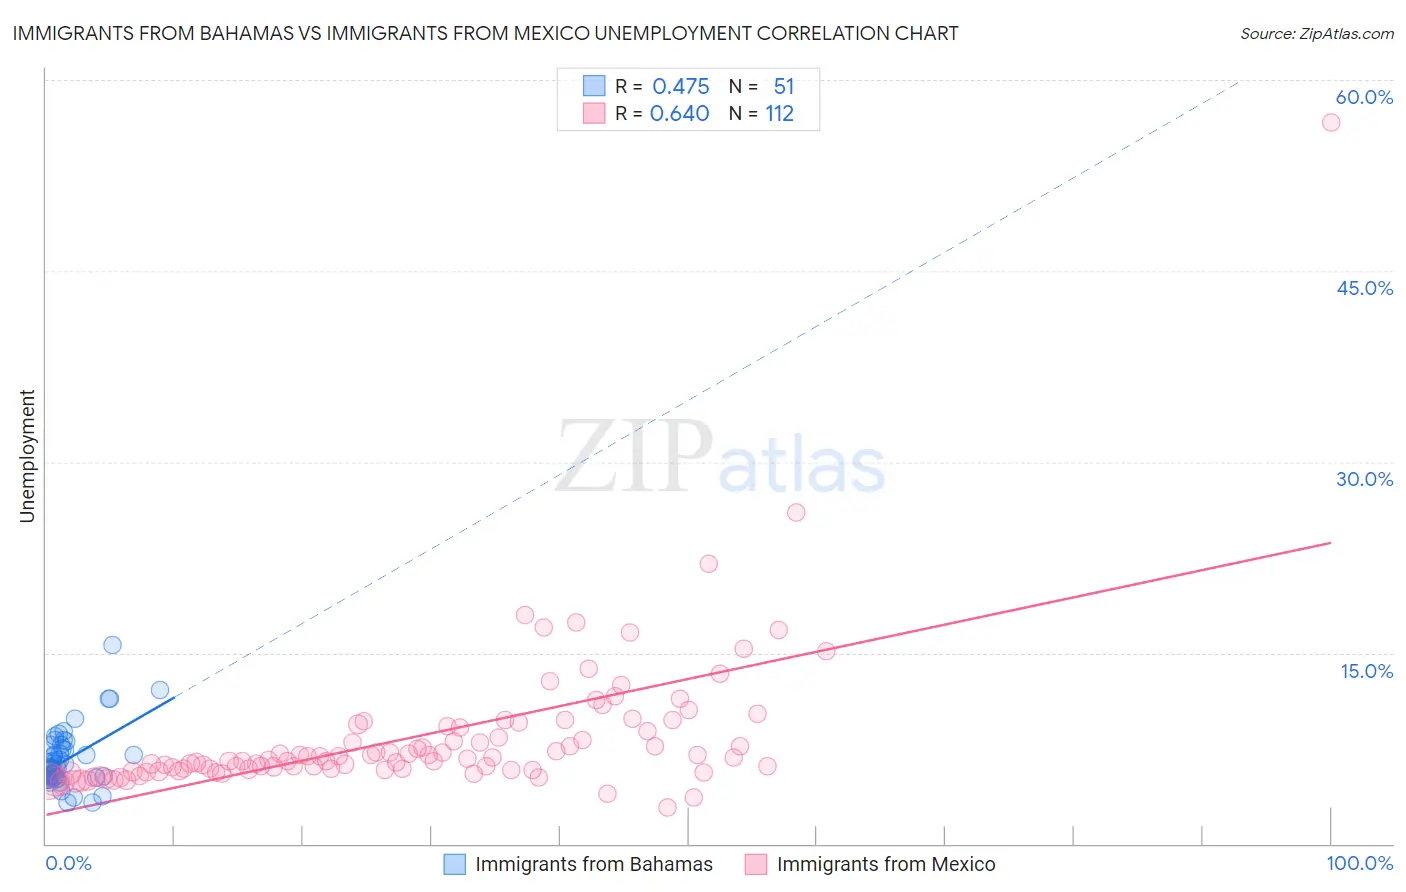
Immigrants from Bahamas vs Immigrants from Mexico Unemployment Correlation Chart
The statistical analysis conducted on geographies consisting of 104,648,051 people shows a moderate positive correlation between the proportion of Immigrants from Bahamas and unemployment in the United States with a correlation coefficient (R) of 0.475 and weighted average of 5.8%. Similarly, the statistical analysis conducted on geographies consisting of 511,903,872 people shows a significant positive correlation between the proportion of Immigrants from Mexico and unemployment in the United States with a correlation coefficient (R) of 0.640 and weighted average of 6.0%, a difference of 4.1%.
Unemployment Correlation Summary
| Measurement | Immigrants from Bahamas | Immigrants from Mexico |
| Minimum | 3.2% | 2.8% |
| Maximum | 15.6% | 56.6% |
| Range | 12.4% | 53.8% |
| Mean | 6.6% | 8.4% |
| Median | 6.0% | 6.6% |
| Interquartile 25% (IQ1) | 5.2% | 5.8% |
| Interquartile 75% (IQ3) | 7.8% | 9.2% |
| Interquartile Range (IQR) | 2.6% | 3.4% |
| Standard Deviation (Sample) | 2.3% | 6.0% |
| Standard Deviation (Population) | 2.3% | 5.9% |
Similar Demographics by Unemployment
Demographics Similar to Immigrants from Bahamas by Unemployment
In terms of unemployment, the demographic groups most similar to Immigrants from Bahamas are Subsaharan African (5.8%, a difference of 0.12%), Yaqui (5.8%, a difference of 0.14%), Immigrants from Uzbekistan (5.8%, a difference of 0.14%), Immigrants from Guatemala (5.8%, a difference of 0.16%), and Sierra Leonean (5.8%, a difference of 0.26%).
| Demographics | Rating | Rank | Unemployment |
| Kiowa | 0.6 /100 | #251 | Tragic 5.7% |
| Hondurans | 0.3 /100 | #252 | Tragic 5.7% |
| Central Americans | 0.3 /100 | #253 | Tragic 5.7% |
| Immigrants | Honduras | 0.3 /100 | #254 | Tragic 5.7% |
| Immigrants | Portugal | 0.2 /100 | #255 | Tragic 5.7% |
| Guatemalans | 0.2 /100 | #256 | Tragic 5.8% |
| Yaqui | 0.2 /100 | #257 | Tragic 5.8% |
| Immigrants | Bahamas | 0.1 /100 | #258 | Tragic 5.8% |
| Sub-Saharan Africans | 0.1 /100 | #259 | Tragic 5.8% |
| Immigrants | Uzbekistan | 0.1 /100 | #260 | Tragic 5.8% |
| Immigrants | Guatemala | 0.1 /100 | #261 | Tragic 5.8% |
| Sierra Leoneans | 0.1 /100 | #262 | Tragic 5.8% |
| Salvadorans | 0.1 /100 | #263 | Tragic 5.8% |
| Immigrants | Liberia | 0.1 /100 | #264 | Tragic 5.8% |
| Nigerians | 0.1 /100 | #265 | Tragic 5.8% |
Demographics Similar to Immigrants from Mexico by Unemployment
In terms of unemployment, the demographic groups most similar to Immigrants from Mexico are Immigrants from Western Africa (6.0%, a difference of 0.0%), Ghanaian (6.0%, a difference of 0.43%), African (6.1%, a difference of 0.58%), Immigrants from the Azores (6.1%, a difference of 0.65%), and Armenian (6.0%, a difference of 0.72%).
| Demographics | Rating | Rank | Unemployment |
| Hispanics or Latinos | 0.0 /100 | #272 | Tragic 5.9% |
| Immigrants | Fiji | 0.0 /100 | #273 | Tragic 5.9% |
| Bahamians | 0.0 /100 | #274 | Tragic 5.9% |
| Immigrants | Latin America | 0.0 /100 | #275 | Tragic 5.9% |
| Immigrants | Central America | 0.0 /100 | #276 | Tragic 6.0% |
| Armenians | 0.0 /100 | #277 | Tragic 6.0% |
| Ghanaians | 0.0 /100 | #278 | Tragic 6.0% |
| Immigrants | Mexico | 0.0 /100 | #279 | Tragic 6.0% |
| Immigrants | Western Africa | 0.0 /100 | #280 | Tragic 6.0% |
| Africans | 0.0 /100 | #281 | Tragic 6.1% |
| Immigrants | Azores | 0.0 /100 | #282 | Tragic 6.1% |
| Immigrants | Ghana | 0.0 /100 | #283 | Tragic 6.1% |
| Aleuts | 0.0 /100 | #284 | Tragic 6.1% |
| Immigrants | Senegal | 0.0 /100 | #285 | Tragic 6.1% |
| Immigrants | Caribbean | 0.0 /100 | #286 | Tragic 6.2% |