Immigrants from Bahamas vs Salvadoran 8th Grade

COMPARE

Immigrants from Bahamas
Race
Ancestry
AfghanAfricanAlaska NativeAlaskan AthabascanAlbanianAleutAlsatianAmericanApacheArabArapahoArgentineanArmenianAssyrian/Chaldean/SyriacAustralianAustrianBahamianBangladeshiBarbadianBasqueBelgianBelizeanBermudanBhutaneseBlackfeetBolivianBrazilianBritishBritish West IndianBulgarianBurmeseCajunCambodianCanadianCape VerdeanCarpatho RusynCelticCentral AmericanCentral American IndianCherokeeCheyenneChickasawChileanChineseChippewaChoctawColombianColvilleComancheCosta RicanCreeCreekCroatianCrowCubanCypriotCzechCzechoslovakianDanishDelawareDominicanDutchDutch West IndianEastern EuropeanEcuadorianEgyptianEnglishEstonianEthiopianEuropeanFijianFilipinoFinnishFrenchFrench American IndianFrench CanadianGermanGerman RussianGhanaianGreekGuamanian/ChamorroGuatemalanGuyaneseHaitianHmongHonduranHopiHoumaHungarianIcelanderIndian (Asian)IndonesianInupiatIranianIraqiIrishIroquoisIsraeliItalianJamaicanJapaneseJordanianKenyanKiowaKoreanLaotianLatvianLebaneseLiberianLithuanianLumbeeLuxembourgerMacedonianMalaysianMalteseMarshalleseMenomineeMexicanMexican American IndianMongolianMoroccanNative HawaiianNavajoNepaleseNew ZealanderNicaraguanNigerianNorthern EuropeanNorwegianOkinawanOsageOttawaPaiutePakistaniPalestinianPanamanianParaguayanPennsylvania GermanPeruvianPimaPolishPortuguesePotawatomiPuebloPuerto RicanPuget Sound SalishRomanianRussianSamoanScandinavianScotch-IrishScottishSeminoleSenegaleseSerbianShoshoneSierra LeoneanSiouxSlavicSlovakSloveneSomaliSouth AfricanSouth AmericanSouth American IndianSoviet UnionSpaniardSpanishSpanish AmericanSpanish American IndianSri LankanSubsaharan AfricanSudaneseSwedishSwissSyrianTaiwaneseThaiTlingit-HaidaTohono O'OdhamTonganTrinidadian and TobagonianTsimshianTurkishU.S. Virgin IslanderUgandanUkrainianUruguayanUteVenezuelanVietnameseWelshWest IndianYakamaYaquiYugoslavianYumanYup'ikZimbabwean
Immigration
NonimmigrantsImmigrantsAfghanistanAfricaAlbaniaArgentinaArmeniaAsiaAustraliaAustriaBahamasBangladeshBarbadosBelarusBelgiumBelizeBoliviaBosnia and HerzegovinaBrazilBulgariaBurma/MyanmarCabo VerdeCambodiaCameroonCanadaCaribbeanCentral AmericaChileChinaColombiaCongoCosta RicaCroatiaCubaCzechoslovakiaDenmarkDominicaDominican RepublicEastern AfricaEastern AsiaEastern EuropeEcuadorEgyptEl SalvadorEnglandEritreaEthiopiaEuropeFijiFranceGermanyGhanaGreeceGrenadaGuatemalaGuyanaHaitiHondurasHong KongHungaryIndiaIndonesiaIranIraqIrelandIsraelItalyJamaicaJapanJordanKazakhstanKenyaKoreaKuwaitLaosLatin AmericaLatviaLebanonLiberiaLithuaniaMalaysiaMexicoMicronesiaMiddle AfricaMoldovaMoroccoNepalNetherlandsNicaraguaNigeriaNorth AmericaNorth MacedoniaNorthern AfricaNorthern EuropeNorwayOceaniaPakistanPanamaPeruPhilippinesPolandPortugalRomaniaRussiaSaudi ArabiaScotlandSenegalSerbiaSierra LeoneSingaporeSomaliaSouth AfricaSouth AmericaSouth Central AsiaSouth Eastern AsiaSouthern EuropeSpainSri LankaSt. Vincent and the GrenadinesSudanSwedenSwitzerlandSyriaTaiwanThailandTrinidad and TobagoTurkeyUgandaUkraineUruguayUzbekistanVenezuelaVietnamWest IndiesWestern AfricaWestern AsiaWestern EuropeYemenZaireZimbabweAzores
Salvadoran
Race
Ancestry
AfghanAfricanAlaska NativeAlaskan AthabascanAlbanianAleutAlsatianAmericanApacheArabArapahoArgentineanArmenianAssyrian/Chaldean/SyriacAustralianAustrianBahamianBangladeshiBarbadianBasqueBelgianBelizeanBermudanBhutaneseBlackfeetBolivianBrazilianBritishBritish West IndianBulgarianBurmeseCajunCambodianCanadianCape VerdeanCarpatho RusynCelticCentral AmericanCentral American IndianCherokeeCheyenneChickasawChileanChineseChippewaChoctawColombianColvilleComancheCosta RicanCreeCreekCroatianCrowCubanCypriotCzechCzechoslovakianDanishDelawareDominicanDutchDutch West IndianEastern EuropeanEcuadorianEgyptianEnglishEstonianEthiopianEuropeanFijianFilipinoFinnishFrenchFrench American IndianFrench CanadianGermanGerman RussianGhanaianGreekGuamanian/ChamorroGuatemalanGuyaneseHaitianHmongHonduranHopiHoumaHungarianIcelanderIndian (Asian)IndonesianInupiatIranianIraqiIrishIroquoisIsraeliItalianJamaicanJapaneseJordanianKenyanKiowaKoreanLaotianLatvianLebaneseLiberianLithuanianLumbeeLuxembourgerMacedonianMalaysianMalteseMarshalleseMenomineeMexicanMexican American IndianMongolianMoroccanNative HawaiianNavajoNepaleseNew ZealanderNicaraguanNigerianNorthern EuropeanNorwegianOkinawanOsageOttawaPaiutePakistaniPalestinianPanamanianParaguayanPennsylvania GermanPeruvianPimaPolishPortuguesePotawatomiPuebloPuerto RicanPuget Sound SalishRomanianRussianSalvadoranSamoanScandinavianScotch-IrishScottishSeminoleSenegaleseSerbianShoshoneSierra LeoneanSiouxSlavicSlovakSloveneSomaliSouth AfricanSouth AmericanSouth American IndianSoviet UnionSpaniardSpanishSpanish AmericanSpanish American IndianSri LankanSubsaharan AfricanSudaneseSwedishSwissSyrianTaiwaneseThaiTlingit-HaidaTohono O'OdhamTonganTrinidadian and TobagonianTsimshianTurkishU.S. Virgin IslanderUgandanUkrainianUruguayanUteVenezuelanVietnameseWelshWest IndianYakamaYaquiYugoslavianYumanYup'ikZimbabwean
Immigration
NonimmigrantsImmigrantsAfghanistanAfricaAlbaniaArgentinaArmeniaAsiaAustraliaAustriaBangladeshBarbadosBelarusBelgiumBelizeBoliviaBosnia and HerzegovinaBrazilBulgariaBurma/MyanmarCabo VerdeCambodiaCameroonCanadaCaribbeanCentral AmericaChileChinaColombiaCongoCosta RicaCroatiaCubaCzechoslovakiaDenmarkDominicaDominican RepublicEastern AfricaEastern AsiaEastern EuropeEcuadorEgyptEl SalvadorEnglandEritreaEthiopiaEuropeFijiFranceGermanyGhanaGreeceGrenadaGuatemalaGuyanaHaitiHondurasHong KongHungaryIndiaIndonesiaIranIraqIrelandIsraelItalyJamaicaJapanJordanKazakhstanKenyaKoreaKuwaitLaosLatin AmericaLatviaLebanonLiberiaLithuaniaMalaysiaMexicoMicronesiaMiddle AfricaMoldovaMoroccoNepalNetherlandsNicaraguaNigeriaNorth AmericaNorth MacedoniaNorthern AfricaNorthern EuropeNorwayOceaniaPakistanPanamaPeruPhilippinesPolandPortugalRomaniaRussiaSaudi ArabiaScotlandSenegalSerbiaSierra LeoneSingaporeSomaliaSouth AfricaSouth AmericaSouth Central AsiaSouth Eastern AsiaSouthern EuropeSpainSri LankaSt. Vincent and the GrenadinesSudanSwedenSwitzerlandSyriaTaiwanThailandTrinidad and TobagoTurkeyUgandaUkraineUruguayUzbekistanVenezuelaVietnamWest IndiesWestern AfricaWestern AsiaWestern EuropeYemenZaireZimbabweAzores
8th Grade
Income
Poverty
Unemployment
Labor Participation
Family Structure
Vehicle Availability
Education Level
Disability

8th Grade Comparison

Immigrants from Bahamas

Salvadorans

Poor
Tragic
95.5%
8TH GRADE
16.7/ 100
METRIC RATING
205th/ 347
METRIC RANK
90.9%
8TH GRADE
0.0/ 100
METRIC RATING
342nd/ 347
METRIC RANK

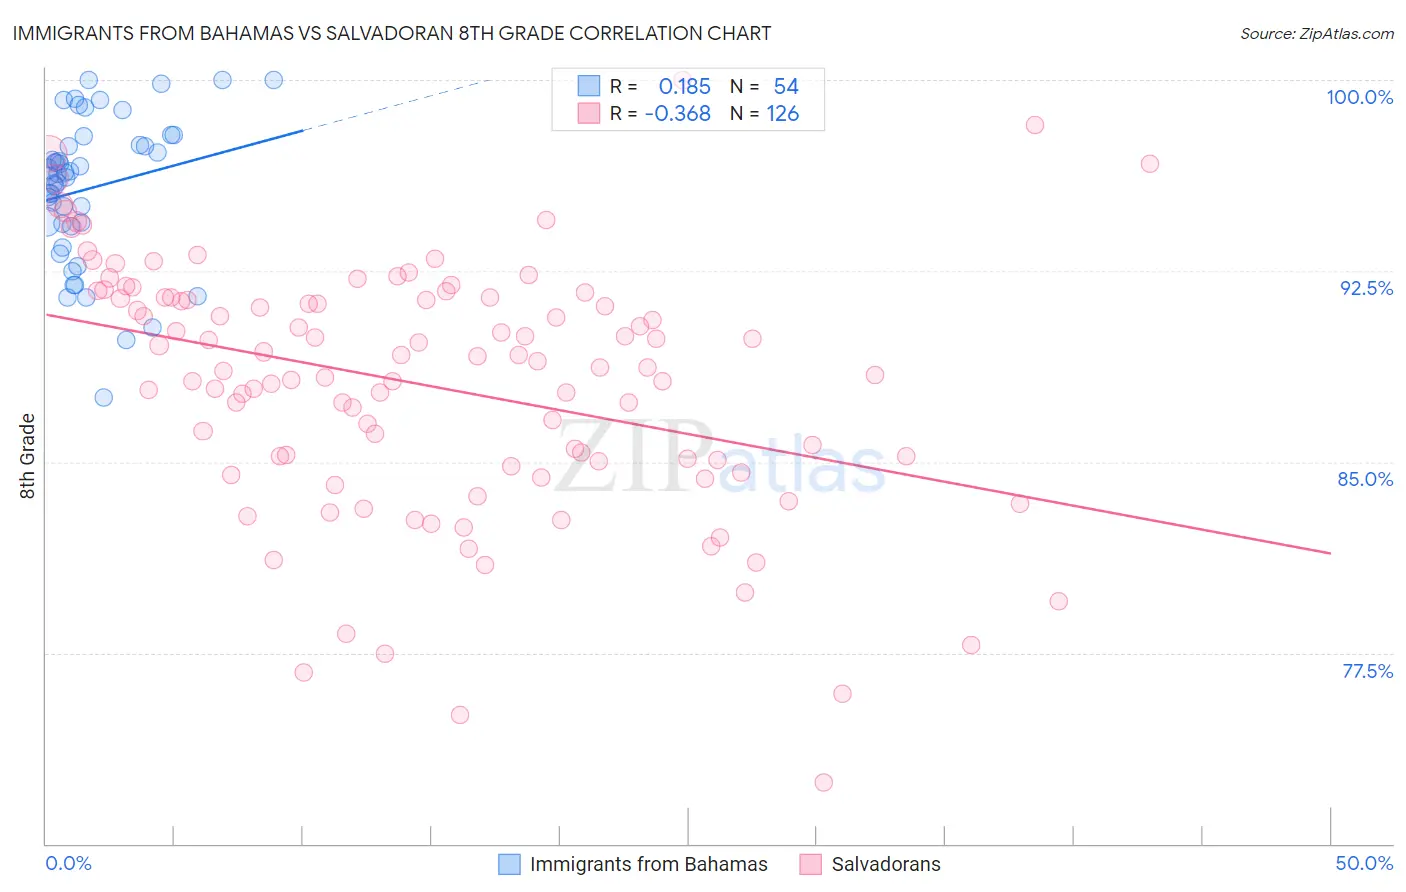
Immigrants from Bahamas vs Salvadoran 8th Grade Correlation Chart

The statistical analysis conducted on geographies consisting of 104,666,801 people shows a poor positive correlation between the proportion of Immigrants from Bahamas and percentage of population with at least 8th grade education in the United States with a correlation coefficient (R) of 0.185 and weighted average of 95.5%. Similarly, the statistical analysis conducted on geographies consisting of 399,020,248 people shows a mild negative correlation between the proportion of Salvadorans and percentage of population with at least 8th grade education in the United States with a correlation coefficient (R) of -0.368 and weighted average of 90.9%, a difference of 5.1%.
Immigrants from Bahamas vs Salvadoran 8th Grade

8th Grade Correlation Summary

MeasurementImmigrants from BahamasSalvadoran
Minimum87.5%72.4%
Maximum100.0%100.0%
Range12.5%27.6%
Mean95.7%88.0%
Median96.3%88.7%
Interquartile 25% (IQ1)94.3%85.0%
Interquartile 75% (IQ3)97.4%91.4%
Interquartile Range (IQR)3.1%6.4%
Standard Deviation (Sample)2.8%5.0%
Standard Deviation (Population)2.8%5.0%

Similar Demographics by 8th Grade

Demographics Similar to Immigrants from Bahamas by 8th Grade

In terms of 8th grade, the demographic groups most similar to Immigrants from Bahamas are Hawaiian (95.5%, a difference of 0.0%), Comanche (95.5%, a difference of 0.0%), Moroccan (95.5%, a difference of 0.010%), Immigrants from Sudan (95.5%, a difference of 0.020%), and Apache (95.5%, a difference of 0.030%).
DemographicsRating | Rank8th Grade
Paraguayans
22.6
/100
|
#198
Fair
95.5%
Immigrants | Northern Africa
22.5
/100
|
#199
Fair
95.5%
Argentineans
22.2
/100
|
#200
Fair
95.5%
Immigrants | Argentina
20.6
/100
|
#201
Fair
95.5%
Apache
19.4
/100
|
#202
Poor
95.5%
Moroccans
17.4
/100
|
#203
Poor
95.5%
Hawaiians
16.7
/100
|
#204
Poor
95.5%
Immigrants | Bahamas
16.7
/100
|
#205
Poor
95.5%
Comanche
16.3
/100
|
#206
Poor
95.5%
Immigrants | Sudan
15.1
/100
|
#207
Poor
95.5%
Portuguese
14.3
/100
|
#208
Poor
95.5%
Immigrants | Lebanon
13.7
/100
|
#209
Poor
95.4%
Africans
13.6
/100
|
#210
Poor
95.4%
Immigrants | Morocco
12.4
/100
|
#211
Poor
95.4%
Immigrants | Pakistan
9.7
/100
|
#212
Tragic
95.4%

Demographics Similar to Salvadorans by 8th Grade

In terms of 8th grade, the demographic groups most similar to Salvadorans are Immigrants from Guatemala (90.7%, a difference of 0.17%), Guatemalan (91.1%, a difference of 0.29%), Yakama (91.2%, a difference of 0.40%), Mexican (91.4%, a difference of 0.53%), and Immigrants from Central America (90.4%, a difference of 0.54%).
DemographicsRating | Rank8th Grade
Hispanics or Latinos
0.0
/100
|
#333
Tragic
92.2%
Immigrants | Yemen
0.0
/100
|
#334
Tragic
92.1%
Mexican American Indians
0.0
/100
|
#335
Tragic
92.1%
Immigrants | Honduras
0.0
/100
|
#336
Tragic
91.9%
Immigrants | Latin America
0.0
/100
|
#337
Tragic
91.7%
Central Americans
0.0
/100
|
#338
Tragic
91.6%
Mexicans
0.0
/100
|
#339
Tragic
91.4%
Yakama
0.0
/100
|
#340
Tragic
91.2%
Guatemalans
0.0
/100
|
#341
Tragic
91.1%
Salvadorans
0.0
/100
|
#342
Tragic
90.9%
Immigrants | Guatemala
0.0
/100
|
#343
Tragic
90.7%
Immigrants | Central America
0.0
/100
|
#344
Tragic
90.4%
Immigrants | El Salvador
0.0
/100
|
#345
Tragic
90.3%
Immigrants | Mexico
0.0
/100
|
#346
Tragic
90.2%
Spanish American Indians
0.0
/100
|
#347
Tragic
89.8%