Immigrants from Bahamas vs Pennsylvania German Unemployment Among Youth under 25 years
COMPARE
Immigrants from Bahamas
Pennsylvania German
Unemployment Among Youth under 25 years
Unemployment Among Youth under 25 years Comparison
Immigrants from Bahamas
Pennsylvania Germans
12.9%
UNEMPLOYMENT AMONG YOUTH UNDER 25 YEARS
0.0/ 100
METRIC RATING
271st/ 347
METRIC RANK
10.6%
UNEMPLOYMENT AMONG YOUTH UNDER 25 YEARS
100.0/ 100
METRIC RATING
21st/ 347
METRIC RANK
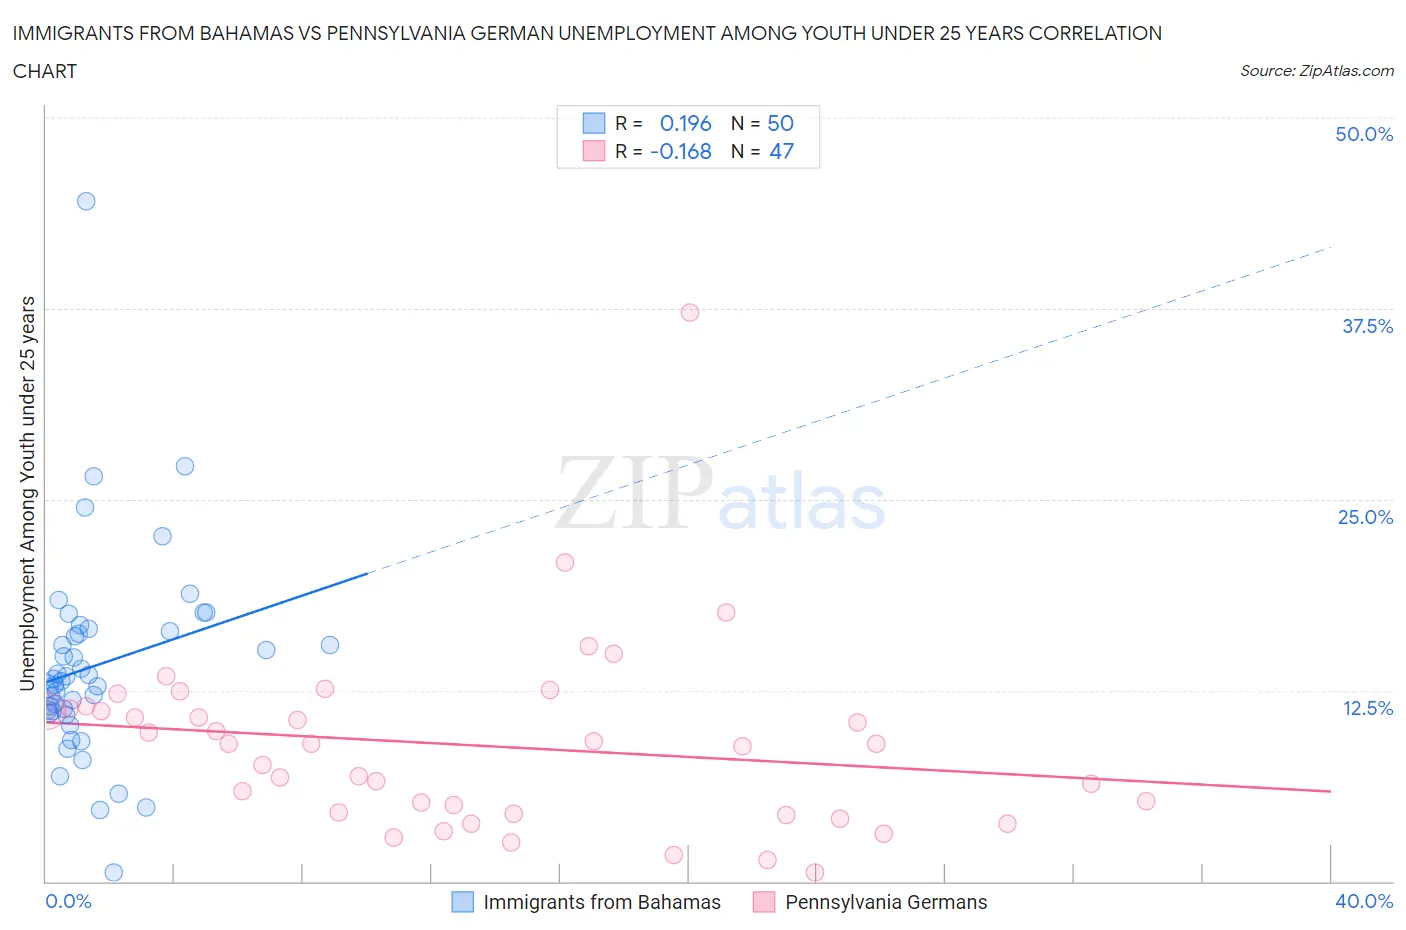
Immigrants from Bahamas vs Pennsylvania German Unemployment Among Youth under 25 years Correlation Chart
The statistical analysis conducted on geographies consisting of 104,451,024 people shows a poor positive correlation between the proportion of Immigrants from Bahamas and unemployment rate among youth under the age of 25 in the United States with a correlation coefficient (R) of 0.196 and weighted average of 12.9%. Similarly, the statistical analysis conducted on geographies consisting of 230,294,303 people shows a poor negative correlation between the proportion of Pennsylvania Germans and unemployment rate among youth under the age of 25 in the United States with a correlation coefficient (R) of -0.168 and weighted average of 10.6%, a difference of 21.3%.
Unemployment Among Youth under 25 years Correlation Summary
| Measurement | Immigrants from Bahamas | Pennsylvania German |
| Minimum | 0.60% | 0.60% |
| Maximum | 44.5% | 37.2% |
| Range | 43.9% | 36.6% |
| Mean | 14.1% | 8.9% |
| Median | 13.2% | 9.0% |
| Interquartile 25% (IQ1) | 11.1% | 4.4% |
| Interquartile 75% (IQ3) | 16.4% | 11.3% |
| Interquartile Range (IQR) | 5.3% | 6.9% |
| Standard Deviation (Sample) | 6.7% | 6.1% |
| Standard Deviation (Population) | 6.7% | 6.1% |
Similar Demographics by Unemployment Among Youth under 25 years
Demographics Similar to Immigrants from Bahamas by Unemployment Among Youth under 25 years
In terms of unemployment among youth under 25 years, the demographic groups most similar to Immigrants from Bahamas are Cape Verdean (12.9%, a difference of 0.22%), Immigrants from Liberia (12.8%, a difference of 0.53%), Nigerian (13.0%, a difference of 0.57%), Immigrants from Nigeria (13.0%, a difference of 1.1%), and Bermudan (13.0%, a difference of 1.3%).
| Demographics | Rating | Rank | Unemployment Among Youth under 25 years |
| Puget Sound Salish | 0.1 /100 | #264 | Tragic 12.5% |
| Nepalese | 0.0 /100 | #265 | Tragic 12.5% |
| Immigrants | Latin America | 0.0 /100 | #266 | Tragic 12.6% |
| Sub-Saharan Africans | 0.0 /100 | #267 | Tragic 12.6% |
| Tlingit-Haida | 0.0 /100 | #268 | Tragic 12.7% |
| Kiowa | 0.0 /100 | #269 | Tragic 12.7% |
| Immigrants | Liberia | 0.0 /100 | #270 | Tragic 12.8% |
| Immigrants | Bahamas | 0.0 /100 | #271 | Tragic 12.9% |
| Cape Verdeans | 0.0 /100 | #272 | Tragic 12.9% |
| Nigerians | 0.0 /100 | #273 | Tragic 13.0% |
| Immigrants | Nigeria | 0.0 /100 | #274 | Tragic 13.0% |
| Bermudans | 0.0 /100 | #275 | Tragic 13.0% |
| Immigrants | Uzbekistan | 0.0 /100 | #276 | Tragic 13.1% |
| Bahamians | 0.0 /100 | #277 | Tragic 13.1% |
| Africans | 0.0 /100 | #278 | Tragic 13.2% |
Demographics Similar to Pennsylvania Germans by Unemployment Among Youth under 25 years
In terms of unemployment among youth under 25 years, the demographic groups most similar to Pennsylvania Germans are Belgian (10.6%, a difference of 0.010%), Immigrants from Bosnia and Herzegovina (10.6%, a difference of 0.070%), Dutch (10.6%, a difference of 0.21%), Immigrants from Burma/Myanmar (10.6%, a difference of 0.23%), and Swiss (10.6%, a difference of 0.25%).
| Demographics | Rating | Rank | Unemployment Among Youth under 25 years |
| Cubans | 100.0 /100 | #14 | Exceptional 10.6% |
| Sudanese | 100.0 /100 | #15 | Exceptional 10.6% |
| Venezuelans | 100.0 /100 | #16 | Exceptional 10.6% |
| Menominee | 100.0 /100 | #17 | Exceptional 10.6% |
| Swiss | 100.0 /100 | #18 | Exceptional 10.6% |
| Immigrants | Burma/Myanmar | 100.0 /100 | #19 | Exceptional 10.6% |
| Dutch | 100.0 /100 | #20 | Exceptional 10.6% |
| Pennsylvania Germans | 100.0 /100 | #21 | Exceptional 10.6% |
| Belgians | 100.0 /100 | #22 | Exceptional 10.6% |
| Immigrants | Bosnia and Herzegovina | 100.0 /100 | #23 | Exceptional 10.6% |
| Finns | 100.0 /100 | #24 | Exceptional 10.7% |
| Immigrants | North Macedonia | 100.0 /100 | #25 | Exceptional 10.7% |
| Immigrants | India | 100.0 /100 | #26 | Exceptional 10.7% |
| Yugoslavians | 100.0 /100 | #27 | Exceptional 10.7% |
| Somalis | 100.0 /100 | #28 | Exceptional 10.7% |