Palestinian vs Immigrants from Japan Unemployment Among Youth under 25 years
COMPARE
Palestinian
Immigrants from Japan
Unemployment Among Youth under 25 years
Unemployment Among Youth under 25 years Comparison
Palestinians
Immigrants from Japan
11.8%
UNEMPLOYMENT AMONG YOUTH UNDER 25 YEARS
16.0/ 100
METRIC RATING
201st/ 347
METRIC RANK
11.2%
UNEMPLOYMENT AMONG YOUTH UNDER 25 YEARS
95.5/ 100
METRIC RATING
89th/ 347
METRIC RANK
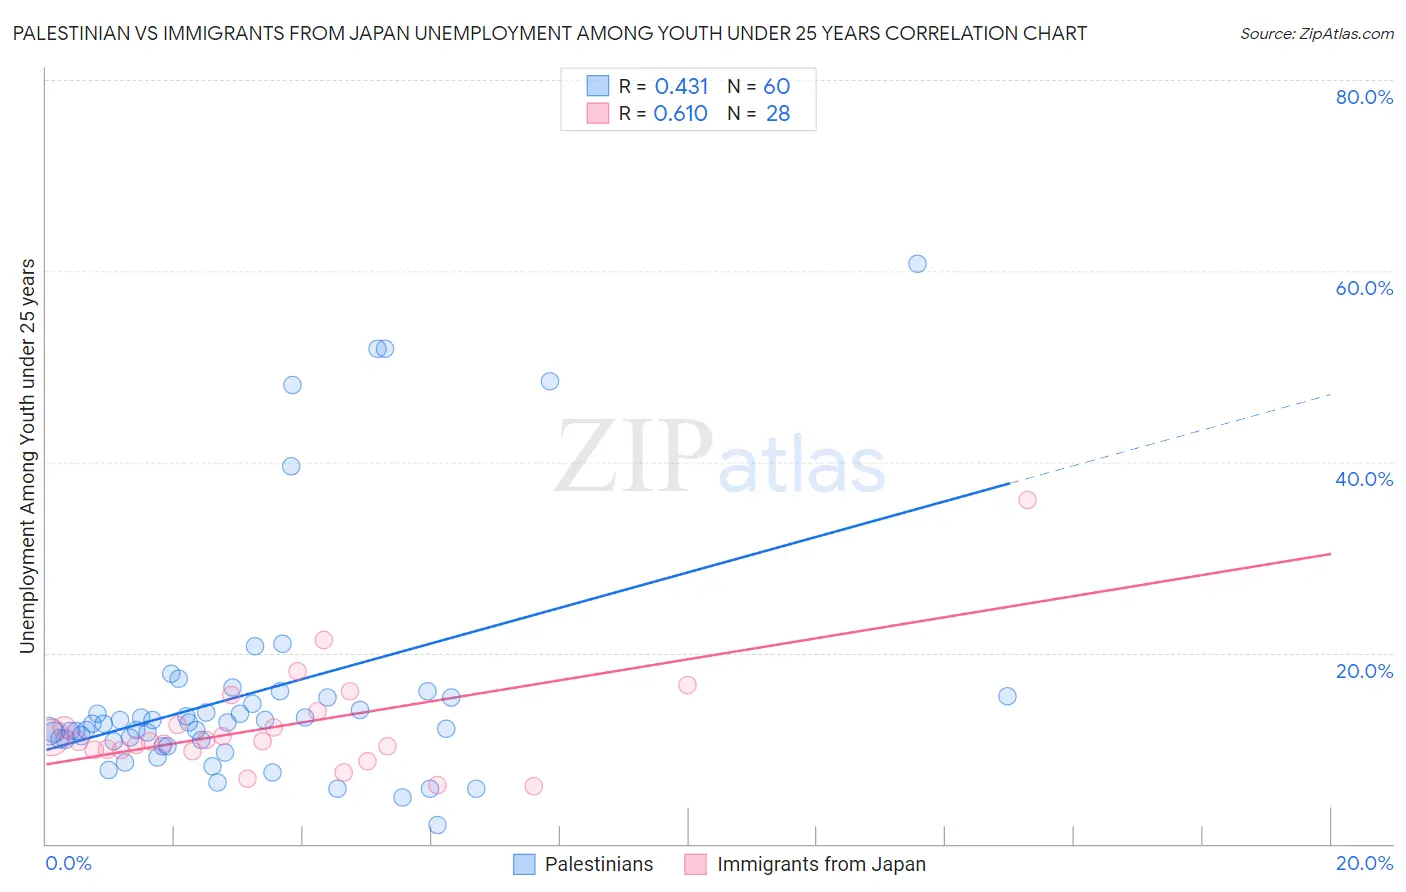
Palestinian vs Immigrants from Japan Unemployment Among Youth under 25 years Correlation Chart
The statistical analysis conducted on geographies consisting of 215,804,460 people shows a moderate positive correlation between the proportion of Palestinians and unemployment rate among youth under the age of 25 in the United States with a correlation coefficient (R) of 0.431 and weighted average of 11.8%. Similarly, the statistical analysis conducted on geographies consisting of 337,330,907 people shows a significant positive correlation between the proportion of Immigrants from Japan and unemployment rate among youth under the age of 25 in the United States with a correlation coefficient (R) of 0.610 and weighted average of 11.2%, a difference of 5.0%.
Unemployment Among Youth under 25 years Correlation Summary
| Measurement | Palestinian | Immigrants from Japan |
| Minimum | 2.0% | 6.0% |
| Maximum | 60.7% | 36.0% |
| Range | 58.7% | 30.0% |
| Mean | 15.7% | 12.3% |
| Median | 12.6% | 10.7% |
| Interquartile 25% (IQ1) | 10.8% | 9.8% |
| Interquartile 75% (IQ3) | 15.3% | 13.2% |
| Interquartile Range (IQR) | 4.5% | 3.4% |
| Standard Deviation (Sample) | 12.2% | 5.8% |
| Standard Deviation (Population) | 12.1% | 5.7% |
Similar Demographics by Unemployment Among Youth under 25 years
Demographics Similar to Palestinians by Unemployment Among Youth under 25 years
In terms of unemployment among youth under 25 years, the demographic groups most similar to Palestinians are Marshallese (11.8%, a difference of 0.020%), Immigrants from Peru (11.8%, a difference of 0.050%), Immigrants from Costa Rica (11.8%, a difference of 0.060%), Arab (11.8%, a difference of 0.15%), and Peruvian (11.8%, a difference of 0.16%).
| Demographics | Rating | Rank | Unemployment Among Youth under 25 years |
| Immigrants | Sri Lanka | 27.8 /100 | #194 | Fair 11.7% |
| Paraguayans | 27.2 /100 | #195 | Fair 11.7% |
| Egyptians | 26.9 /100 | #196 | Fair 11.7% |
| Koreans | 23.9 /100 | #197 | Fair 11.7% |
| Cherokee | 21.2 /100 | #198 | Fair 11.8% |
| Immigrants | Colombia | 20.9 /100 | #199 | Fair 11.8% |
| Arabs | 18.0 /100 | #200 | Poor 11.8% |
| Palestinians | 16.0 /100 | #201 | Poor 11.8% |
| Marshallese | 15.8 /100 | #202 | Poor 11.8% |
| Immigrants | Peru | 15.3 /100 | #203 | Poor 11.8% |
| Immigrants | Costa Rica | 15.2 /100 | #204 | Poor 11.8% |
| Peruvians | 14.0 /100 | #205 | Poor 11.8% |
| Immigrants | Pakistan | 12.6 /100 | #206 | Poor 11.8% |
| Immigrants | Southern Europe | 12.3 /100 | #207 | Poor 11.8% |
| Comanche | 12.1 /100 | #208 | Poor 11.8% |
Demographics Similar to Immigrants from Japan by Unemployment Among Youth under 25 years
In terms of unemployment among youth under 25 years, the demographic groups most similar to Immigrants from Japan are Austrian (11.2%, a difference of 0.0%), Immigrants from Bolivia (11.2%, a difference of 0.010%), Kenyan (11.2%, a difference of 0.060%), Immigrants from South Africa (11.2%, a difference of 0.070%), and Immigrants from Taiwan (11.2%, a difference of 0.090%).
| Demographics | Rating | Rank | Unemployment Among Youth under 25 years |
| Northern Europeans | 96.2 /100 | #82 | Exceptional 11.2% |
| Bolivians | 96.1 /100 | #83 | Exceptional 11.2% |
| French Canadians | 95.9 /100 | #84 | Exceptional 11.2% |
| Immigrants | South Central Asia | 95.9 /100 | #85 | Exceptional 11.2% |
| Immigrants | South Africa | 95.8 /100 | #86 | Exceptional 11.2% |
| Kenyans | 95.7 /100 | #87 | Exceptional 11.2% |
| Austrians | 95.5 /100 | #88 | Exceptional 11.2% |
| Immigrants | Japan | 95.5 /100 | #89 | Exceptional 11.2% |
| Immigrants | Bolivia | 95.5 /100 | #90 | Exceptional 11.2% |
| Immigrants | Taiwan | 95.1 /100 | #91 | Exceptional 11.2% |
| Immigrants | Latvia | 95.1 /100 | #92 | Exceptional 11.2% |
| Immigrants | North America | 95.1 /100 | #93 | Exceptional 11.2% |
| Lithuanians | 94.8 /100 | #94 | Exceptional 11.3% |
| Carpatho Rusyns | 94.4 /100 | #95 | Exceptional 11.3% |
| Immigrants | Serbia | 94.4 /100 | #96 | Exceptional 11.3% |