Spanish American vs Belizean Unemployment Among Ages 16 to 19 years
COMPARE
Spanish American
Belizean
Unemployment Among Ages 16 to 19 years
Unemployment Among Ages 16 to 19 years Comparison
Spanish Americans
Belizeans
18.2%
UNEMPLOYMENT AMONG AGES 16 TO 19 YEARS
4.7/ 100
METRIC RATING
230th/ 347
METRIC RANK
21.6%
UNEMPLOYMENT AMONG AGES 16 TO 19 YEARS
0.0/ 100
METRIC RATING
311th/ 347
METRIC RANK
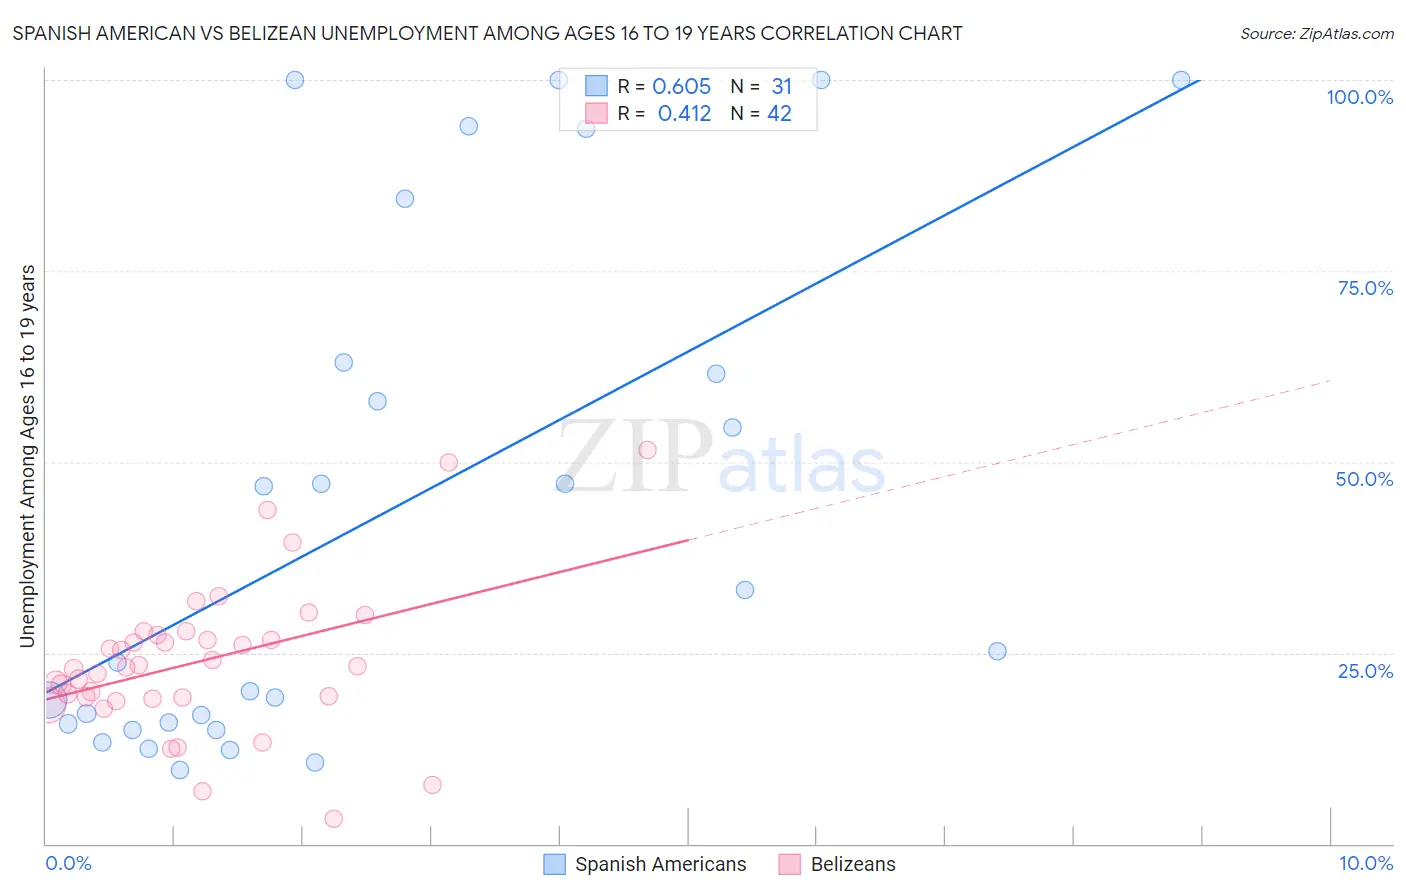
Spanish American vs Belizean Unemployment Among Ages 16 to 19 years Correlation Chart
The statistical analysis conducted on geographies consisting of 101,797,625 people shows a significant positive correlation between the proportion of Spanish Americans and unemployment rate among population between the ages 16 and 19 in the United States with a correlation coefficient (R) of 0.605 and weighted average of 18.2%. Similarly, the statistical analysis conducted on geographies consisting of 141,937,009 people shows a moderate positive correlation between the proportion of Belizeans and unemployment rate among population between the ages 16 and 19 in the United States with a correlation coefficient (R) of 0.412 and weighted average of 21.6%, a difference of 18.5%.
Unemployment Among Ages 16 to 19 years Correlation Summary
| Measurement | Spanish American | Belizean |
| Minimum | 9.7% | 3.2% |
| Maximum | 100.0% | 51.6% |
| Range | 90.3% | 48.4% |
| Mean | 43.3% | 23.9% |
| Median | 25.2% | 23.2% |
| Interquartile 25% (IQ1) | 15.7% | 19.1% |
| Interquartile 75% (IQ3) | 62.9% | 27.4% |
| Interquartile Range (IQR) | 47.2% | 8.3% |
| Standard Deviation (Sample) | 33.1% | 9.8% |
| Standard Deviation (Population) | 32.5% | 9.7% |
Similar Demographics by Unemployment Among Ages 16 to 19 years
Demographics Similar to Spanish Americans by Unemployment Among Ages 16 to 19 years
In terms of unemployment among ages 16 to 19 years, the demographic groups most similar to Spanish Americans are Nepalese (18.2%, a difference of 0.14%), Immigrants from Russia (18.2%, a difference of 0.18%), Seminole (18.2%, a difference of 0.19%), Albanian (18.2%, a difference of 0.26%), and Colombian (18.3%, a difference of 0.29%).
| Demographics | Rating | Rank | Unemployment Among Ages 16 to 19 years |
| Immigrants | Western Asia | 10.2 /100 | #223 | Poor 18.0% |
| Immigrants | Serbia | 8.3 /100 | #224 | Tragic 18.1% |
| Immigrants | Chile | 7.5 /100 | #225 | Tragic 18.1% |
| Immigrants | Belgium | 7.3 /100 | #226 | Tragic 18.1% |
| Immigrants | Liberia | 7.1 /100 | #227 | Tragic 18.1% |
| Immigrants | Greece | 7.1 /100 | #228 | Tragic 18.1% |
| Albanians | 5.8 /100 | #229 | Tragic 18.2% |
| Spanish Americans | 4.7 /100 | #230 | Tragic 18.2% |
| Nepalese | 4.2 /100 | #231 | Tragic 18.2% |
| Immigrants | Russia | 4.0 /100 | #232 | Tragic 18.2% |
| Seminole | 4.0 /100 | #233 | Tragic 18.2% |
| Colombians | 3.7 /100 | #234 | Tragic 18.3% |
| French American Indians | 2.9 /100 | #235 | Tragic 18.3% |
| Immigrants | Colombia | 2.7 /100 | #236 | Tragic 18.3% |
| Immigrants | Immigrants | 2.7 /100 | #237 | Tragic 18.3% |
Demographics Similar to Belizeans by Unemployment Among Ages 16 to 19 years
In terms of unemployment among ages 16 to 19 years, the demographic groups most similar to Belizeans are Vietnamese (21.5%, a difference of 0.22%), Houma (21.6%, a difference of 0.26%), Native/Alaskan (21.5%, a difference of 0.28%), Immigrants from Bangladesh (21.5%, a difference of 0.44%), and Jamaican (21.7%, a difference of 0.67%).
| Demographics | Rating | Rank | Unemployment Among Ages 16 to 19 years |
| Aleuts | 0.0 /100 | #304 | Tragic 21.2% |
| Immigrants | Senegal | 0.0 /100 | #305 | Tragic 21.2% |
| U.S. Virgin Islanders | 0.0 /100 | #306 | Tragic 21.3% |
| Blacks/African Americans | 0.0 /100 | #307 | Tragic 21.4% |
| Immigrants | Bangladesh | 0.0 /100 | #308 | Tragic 21.5% |
| Natives/Alaskans | 0.0 /100 | #309 | Tragic 21.5% |
| Vietnamese | 0.0 /100 | #310 | Tragic 21.5% |
| Belizeans | 0.0 /100 | #311 | Tragic 21.6% |
| Houma | 0.0 /100 | #312 | Tragic 21.6% |
| Jamaicans | 0.0 /100 | #313 | Tragic 21.7% |
| Alaska Natives | 0.0 /100 | #314 | Tragic 21.8% |
| Immigrants | Dominica | 0.0 /100 | #315 | Tragic 21.9% |
| Tohono O'odham | 0.0 /100 | #316 | Tragic 22.1% |
| Immigrants | Belize | 0.0 /100 | #317 | Tragic 22.2% |
| Immigrants | Jamaica | 0.0 /100 | #318 | Tragic 22.2% |