Immigrants from Bahamas vs Barbadian 4th Grade
COMPARE
Immigrants from Bahamas
Barbadian
4th Grade
4th Grade Comparison
Immigrants from Bahamas
Barbadians
97.3%
4TH GRADE
10.8/ 100
METRIC RATING
208th/ 347
METRIC RANK
96.9%
4TH GRADE
0.1/ 100
METRIC RATING
280th/ 347
METRIC RANK
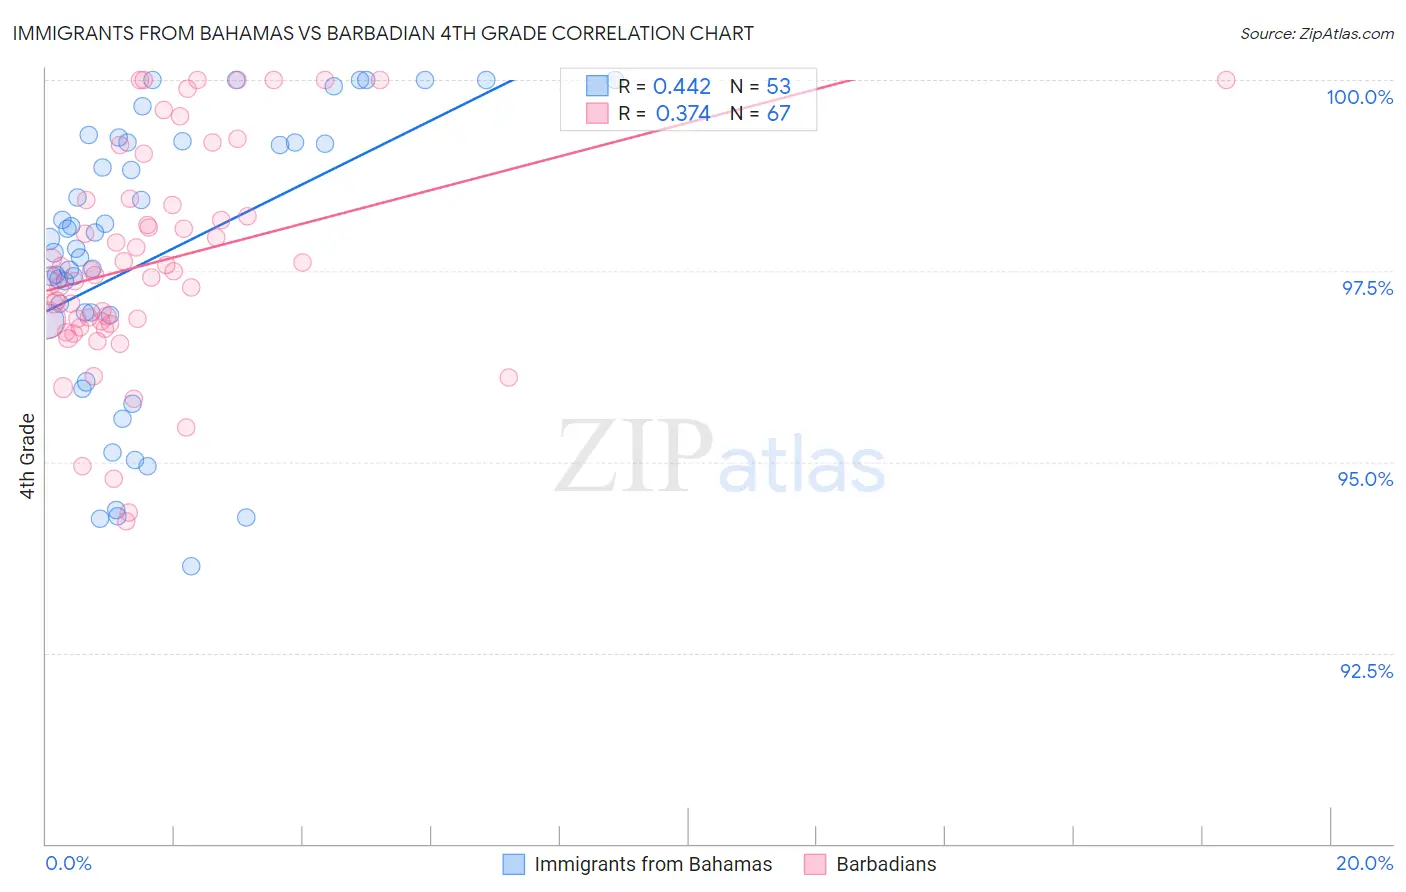
Immigrants from Bahamas vs Barbadian 4th Grade Correlation Chart
The statistical analysis conducted on geographies consisting of 104,665,087 people shows a moderate positive correlation between the proportion of Immigrants from Bahamas and percentage of population with at least 4th grade education in the United States with a correlation coefficient (R) of 0.442 and weighted average of 97.3%. Similarly, the statistical analysis conducted on geographies consisting of 141,304,590 people shows a mild positive correlation between the proportion of Barbadians and percentage of population with at least 4th grade education in the United States with a correlation coefficient (R) of 0.374 and weighted average of 96.9%, a difference of 0.48%.
4th Grade Correlation Summary
| Measurement | Immigrants from Bahamas | Barbadian |
| Minimum | 93.6% | 94.2% |
| Maximum | 100.0% | 100.0% |
| Range | 6.4% | 5.8% |
| Mean | 97.7% | 97.6% |
| Median | 97.8% | 97.5% |
| Interquartile 25% (IQ1) | 96.9% | 96.8% |
| Interquartile 75% (IQ3) | 99.2% | 98.4% |
| Interquartile Range (IQR) | 2.3% | 1.6% |
| Standard Deviation (Sample) | 1.8% | 1.4% |
| Standard Deviation (Population) | 1.8% | 1.4% |
Similar Demographics by 4th Grade
Demographics Similar to Immigrants from Bahamas by 4th Grade
In terms of 4th grade, the demographic groups most similar to Immigrants from Bahamas are Moroccan (97.3%, a difference of 0.010%), Paiute (97.3%, a difference of 0.020%), Immigrants from Zaire (97.3%, a difference of 0.020%), Laotian (97.3%, a difference of 0.020%), and Immigrants from Oceania (97.3%, a difference of 0.020%).
| Demographics | Rating | Rank | 4th Grade |
| Immigrants | Southern Europe | 16.2 /100 | #201 | Poor 97.4% |
| Immigrants | Chile | 16.1 /100 | #202 | Poor 97.4% |
| Immigrants | Northern Africa | 15.1 /100 | #203 | Poor 97.4% |
| Africans | 14.6 /100 | #204 | Poor 97.4% |
| Paiute | 13.2 /100 | #205 | Poor 97.3% |
| Immigrants | Zaire | 12.8 /100 | #206 | Poor 97.3% |
| Moroccans | 11.3 /100 | #207 | Poor 97.3% |
| Immigrants | Bahamas | 10.8 /100 | #208 | Poor 97.3% |
| Laotians | 9.3 /100 | #209 | Tragic 97.3% |
| Immigrants | Oceania | 9.1 /100 | #210 | Tragic 97.3% |
| Sudanese | 9.0 /100 | #211 | Tragic 97.3% |
| Tohono O'odham | 8.4 /100 | #212 | Tragic 97.3% |
| Costa Ricans | 8.3 /100 | #213 | Tragic 97.3% |
| Immigrants | Nepal | 7.7 /100 | #214 | Tragic 97.3% |
| Immigrants | Morocco | 7.1 /100 | #215 | Tragic 97.3% |
Demographics Similar to Barbadians by 4th Grade
In terms of 4th grade, the demographic groups most similar to Barbadians are Afghan (96.9%, a difference of 0.010%), Immigrants from Hong Kong (96.9%, a difference of 0.010%), Yaqui (96.9%, a difference of 0.020%), Immigrants from Western Africa (96.9%, a difference of 0.020%), and Immigrants from Bolivia (96.9%, a difference of 0.020%).
| Demographics | Rating | Rank | 4th Grade |
| Immigrants | Cameroon | 0.1 /100 | #273 | Tragic 96.9% |
| Trinidadians and Tobagonians | 0.1 /100 | #274 | Tragic 96.9% |
| Immigrants | Ghana | 0.1 /100 | #275 | Tragic 96.9% |
| Yaqui | 0.1 /100 | #276 | Tragic 96.9% |
| Immigrants | Western Africa | 0.1 /100 | #277 | Tragic 96.9% |
| Immigrants | Bolivia | 0.1 /100 | #278 | Tragic 96.9% |
| Afghans | 0.1 /100 | #279 | Tragic 96.9% |
| Barbadians | 0.1 /100 | #280 | Tragic 96.9% |
| Immigrants | Hong Kong | 0.1 /100 | #281 | Tragic 96.9% |
| Immigrants | Trinidad and Tobago | 0.1 /100 | #282 | Tragic 96.8% |
| Immigrants | Philippines | 0.1 /100 | #283 | Tragic 96.8% |
| Immigrants | St. Vincent and the Grenadines | 0.1 /100 | #284 | Tragic 96.8% |
| Immigrants | Barbados | 0.0 /100 | #285 | Tragic 96.8% |
| Immigrants | Thailand | 0.0 /100 | #286 | Tragic 96.8% |
| Houma | 0.0 /100 | #287 | Tragic 96.8% |