Yuman vs Immigrants from Bosnia and Herzegovina Female Unemployment
COMPARE
Yuman
Immigrants from Bosnia and Herzegovina
Female Unemployment
Female Unemployment Comparison
Yuman
Immigrants from Bosnia and Herzegovina
9.6%
FEMALE UNEMPLOYMENT
0.0/ 100
METRIC RATING
345th/ 347
METRIC RANK
4.7%
FEMALE UNEMPLOYMENT
99.9/ 100
METRIC RATING
26th/ 347
METRIC RANK
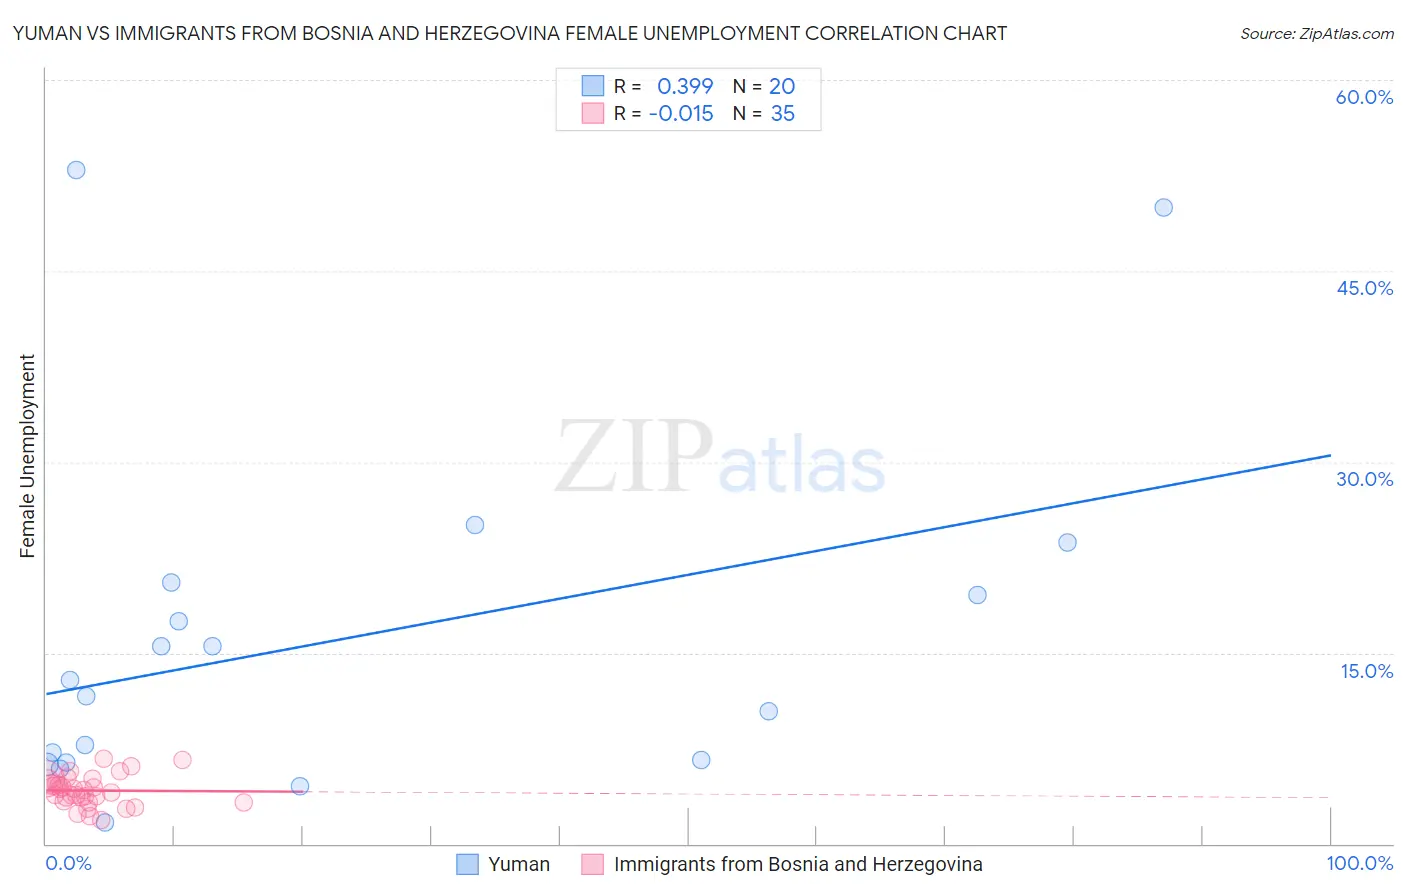
Yuman vs Immigrants from Bosnia and Herzegovina Female Unemployment Correlation Chart
The statistical analysis conducted on geographies consisting of 40,628,844 people shows a mild positive correlation between the proportion of Yuman and unemploymnet rate among females in the United States with a correlation coefficient (R) of 0.399 and weighted average of 9.6%. Similarly, the statistical analysis conducted on geographies consisting of 156,582,357 people shows no correlation between the proportion of Immigrants from Bosnia and Herzegovina and unemploymnet rate among females in the United States with a correlation coefficient (R) of -0.015 and weighted average of 4.7%, a difference of 102.8%.
Female Unemployment Correlation Summary
| Measurement | Yuman | Immigrants from Bosnia and Herzegovina |
| Minimum | 1.7% | 1.9% |
| Maximum | 52.9% | 6.6% |
| Range | 51.2% | 4.7% |
| Mean | 16.1% | 4.2% |
| Median | 12.2% | 4.3% |
| Interquartile 25% (IQ1) | 6.5% | 3.4% |
| Interquartile 75% (IQ3) | 20.0% | 5.0% |
| Interquartile Range (IQR) | 13.5% | 1.7% |
| Standard Deviation (Sample) | 13.8% | 1.2% |
| Standard Deviation (Population) | 13.4% | 1.2% |
Similar Demographics by Female Unemployment
Demographics Similar to Yuman by Female Unemployment
In terms of female unemployment, the demographic groups most similar to Yuman are Pima (9.3%, a difference of 2.8%), Arapaho (8.8%, a difference of 9.1%), Yup'ik (10.9%, a difference of 13.4%), Puerto Rican (8.3%, a difference of 15.0%), and Inupiat (8.2%, a difference of 17.6%).
| Demographics | Rating | Rank | Female Unemployment |
| Menominee | 0.0 /100 | #333 | Tragic 7.0% |
| Immigrants | Armenia | 0.0 /100 | #334 | Tragic 7.1% |
| Dominicans | 0.0 /100 | #335 | Tragic 7.2% |
| Immigrants | Dominican Republic | 0.0 /100 | #336 | Tragic 7.2% |
| Navajo | 0.0 /100 | #337 | Tragic 7.3% |
| Tohono O'odham | 0.0 /100 | #338 | Tragic 7.7% |
| Immigrants | Yemen | 0.0 /100 | #339 | Tragic 7.8% |
| Hopi | 0.0 /100 | #340 | Tragic 8.1% |
| Inupiat | 0.0 /100 | #341 | Tragic 8.2% |
| Puerto Ricans | 0.0 /100 | #342 | Tragic 8.3% |
| Arapaho | 0.0 /100 | #343 | Tragic 8.8% |
| Pima | 0.0 /100 | #344 | Tragic 9.3% |
| Yuman | 0.0 /100 | #345 | Tragic 9.6% |
| Yup'ik | 0.0 /100 | #346 | Tragic 10.9% |
| Crow | 0.0 /100 | #347 | Tragic 12.1% |
Demographics Similar to Immigrants from Bosnia and Herzegovina by Female Unemployment
In terms of female unemployment, the demographic groups most similar to Immigrants from Bosnia and Herzegovina are Immigrants from India (4.7%, a difference of 0.040%), Welsh (4.7%, a difference of 0.13%), British (4.7%, a difference of 0.17%), Irish (4.7%, a difference of 0.20%), and Cypriot (4.7%, a difference of 0.20%).
| Demographics | Rating | Rank | Female Unemployment |
| Poles | 99.9 /100 | #19 | Exceptional 4.7% |
| Bulgarians | 99.9 /100 | #20 | Exceptional 4.7% |
| Fijians | 99.9 /100 | #21 | Exceptional 4.7% |
| Europeans | 99.9 /100 | #22 | Exceptional 4.7% |
| Scottish | 99.9 /100 | #23 | Exceptional 4.7% |
| Welsh | 99.9 /100 | #24 | Exceptional 4.7% |
| Immigrants | India | 99.9 /100 | #25 | Exceptional 4.7% |
| Immigrants | Bosnia and Herzegovina | 99.9 /100 | #26 | Exceptional 4.7% |
| British | 99.9 /100 | #27 | Exceptional 4.7% |
| Irish | 99.9 /100 | #28 | Exceptional 4.7% |
| Cypriots | 99.9 /100 | #29 | Exceptional 4.7% |
| Lithuanians | 99.8 /100 | #30 | Exceptional 4.7% |
| Sudanese | 99.8 /100 | #31 | Exceptional 4.8% |
| Slovaks | 99.8 /100 | #32 | Exceptional 4.8% |
| Czechoslovakians | 99.7 /100 | #33 | Exceptional 4.8% |