Black/African American vs Immigrants from Bosnia and Herzegovina Female Unemployment
COMPARE
Black/African American
Immigrants from Bosnia and Herzegovina
Female Unemployment
Female Unemployment Comparison
Blacks/African Americans
Immigrants from Bosnia and Herzegovina
6.5%
FEMALE UNEMPLOYMENT
0.0/ 100
METRIC RATING
321st/ 347
METRIC RANK
4.7%
FEMALE UNEMPLOYMENT
99.9/ 100
METRIC RATING
26th/ 347
METRIC RANK
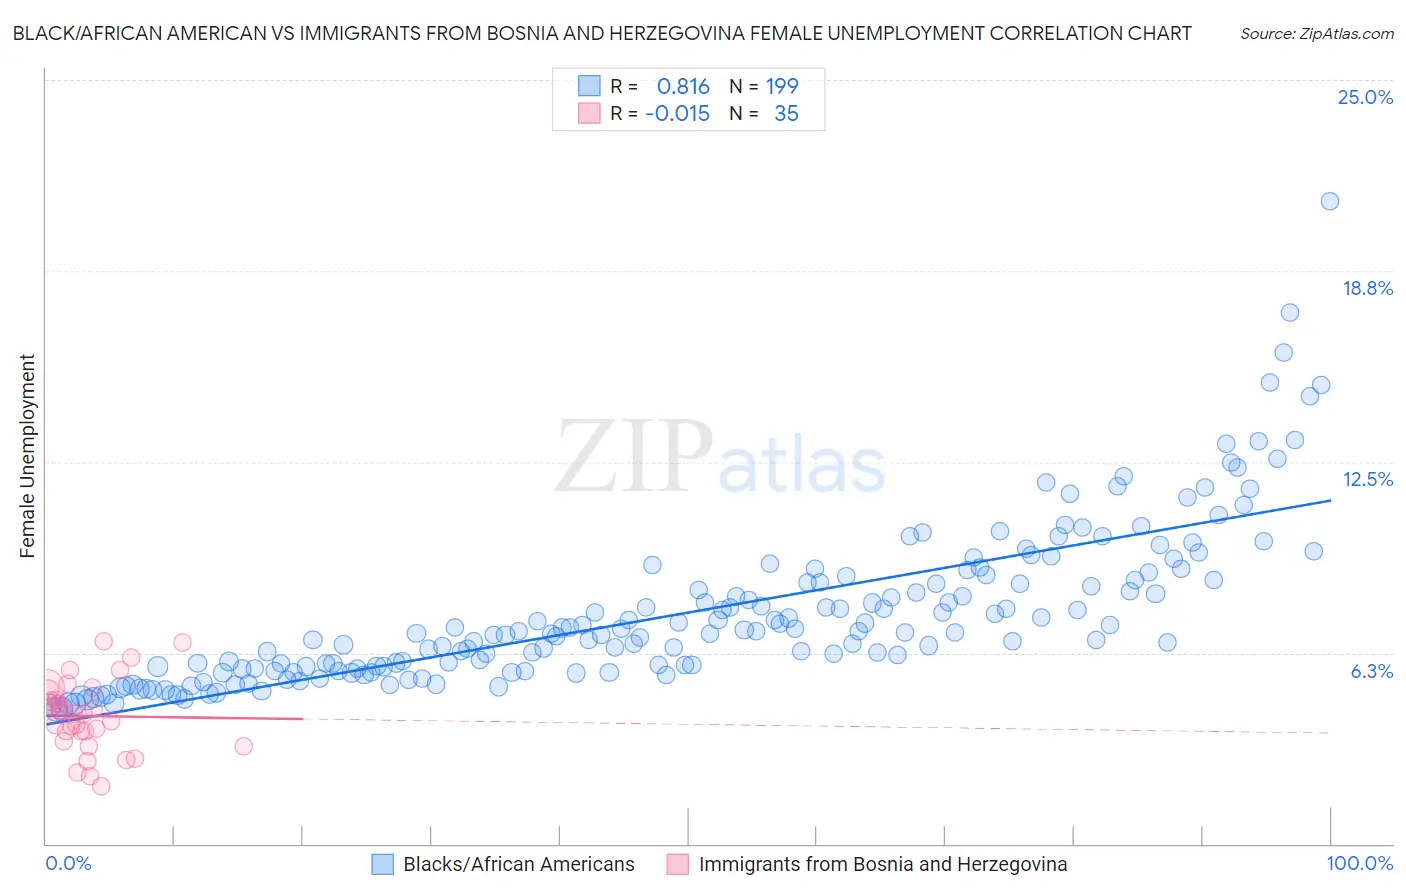
Black/African American vs Immigrants from Bosnia and Herzegovina Female Unemployment Correlation Chart
The statistical analysis conducted on geographies consisting of 554,894,161 people shows a very strong positive correlation between the proportion of Blacks/African Americans and unemploymnet rate among females in the United States with a correlation coefficient (R) of 0.816 and weighted average of 6.5%. Similarly, the statistical analysis conducted on geographies consisting of 156,582,357 people shows no correlation between the proportion of Immigrants from Bosnia and Herzegovina and unemploymnet rate among females in the United States with a correlation coefficient (R) of -0.015 and weighted average of 4.7%, a difference of 37.3%.
Female Unemployment Correlation Summary
| Measurement | Black/African American | Immigrants from Bosnia and Herzegovina |
| Minimum | 4.4% | 1.9% |
| Maximum | 21.0% | 6.6% |
| Range | 16.6% | 4.7% |
| Mean | 7.6% | 4.2% |
| Median | 6.9% | 4.3% |
| Interquartile 25% (IQ1) | 5.7% | 3.4% |
| Interquartile 75% (IQ3) | 8.6% | 5.0% |
| Interquartile Range (IQR) | 2.9% | 1.7% |
| Standard Deviation (Sample) | 2.6% | 1.2% |
| Standard Deviation (Population) | 2.6% | 1.2% |
Similar Demographics by Female Unemployment
Demographics Similar to Blacks/African Americans by Female Unemployment
In terms of female unemployment, the demographic groups most similar to Blacks/African Americans are Vietnamese (6.5%, a difference of 0.080%), Immigrants from Belize (6.5%, a difference of 0.18%), Immigrants from Dominica (6.5%, a difference of 0.54%), Immigrants from Bangladesh (6.5%, a difference of 0.55%), and British West Indian (6.4%, a difference of 0.74%).
| Demographics | Rating | Rank | Female Unemployment |
| Immigrants | Ecuador | 0.0 /100 | #314 | Tragic 6.4% |
| Pueblo | 0.0 /100 | #315 | Tragic 6.4% |
| Houma | 0.0 /100 | #316 | Tragic 6.4% |
| Immigrants | St. Vincent and the Grenadines | 0.0 /100 | #317 | Tragic 6.4% |
| British West Indians | 0.0 /100 | #318 | Tragic 6.4% |
| Immigrants | Bangladesh | 0.0 /100 | #319 | Tragic 6.5% |
| Immigrants | Dominica | 0.0 /100 | #320 | Tragic 6.5% |
| Blacks/African Americans | 0.0 /100 | #321 | Tragic 6.5% |
| Vietnamese | 0.0 /100 | #322 | Tragic 6.5% |
| Immigrants | Belize | 0.0 /100 | #323 | Tragic 6.5% |
| Cheyenne | 0.0 /100 | #324 | Tragic 6.6% |
| Apache | 0.0 /100 | #325 | Tragic 6.6% |
| Natives/Alaskans | 0.0 /100 | #326 | Tragic 6.6% |
| Alaska Natives | 0.0 /100 | #327 | Tragic 6.6% |
| Guyanese | 0.0 /100 | #328 | Tragic 6.7% |
Demographics Similar to Immigrants from Bosnia and Herzegovina by Female Unemployment
In terms of female unemployment, the demographic groups most similar to Immigrants from Bosnia and Herzegovina are Immigrants from India (4.7%, a difference of 0.040%), Welsh (4.7%, a difference of 0.13%), British (4.7%, a difference of 0.17%), Irish (4.7%, a difference of 0.20%), and Cypriot (4.7%, a difference of 0.20%).
| Demographics | Rating | Rank | Female Unemployment |
| Poles | 99.9 /100 | #19 | Exceptional 4.7% |
| Bulgarians | 99.9 /100 | #20 | Exceptional 4.7% |
| Fijians | 99.9 /100 | #21 | Exceptional 4.7% |
| Europeans | 99.9 /100 | #22 | Exceptional 4.7% |
| Scottish | 99.9 /100 | #23 | Exceptional 4.7% |
| Welsh | 99.9 /100 | #24 | Exceptional 4.7% |
| Immigrants | India | 99.9 /100 | #25 | Exceptional 4.7% |
| Immigrants | Bosnia and Herzegovina | 99.9 /100 | #26 | Exceptional 4.7% |
| British | 99.9 /100 | #27 | Exceptional 4.7% |
| Irish | 99.9 /100 | #28 | Exceptional 4.7% |
| Cypriots | 99.9 /100 | #29 | Exceptional 4.7% |
| Lithuanians | 99.8 /100 | #30 | Exceptional 4.7% |
| Sudanese | 99.8 /100 | #31 | Exceptional 4.8% |
| Slovaks | 99.8 /100 | #32 | Exceptional 4.8% |
| Czechoslovakians | 99.7 /100 | #33 | Exceptional 4.8% |