Immigrants from Taiwan vs American Male Unemployment
COMPARE
Immigrants from Taiwan
American
Male Unemployment
Male Unemployment Comparison
Immigrants from Taiwan
Americans
4.8%
MALE UNEMPLOYMENT
99.9/ 100
METRIC RATING
21st/ 347
METRIC RANK
5.2%
MALE UNEMPLOYMENT
72.7/ 100
METRIC RATING
156th/ 347
METRIC RANK
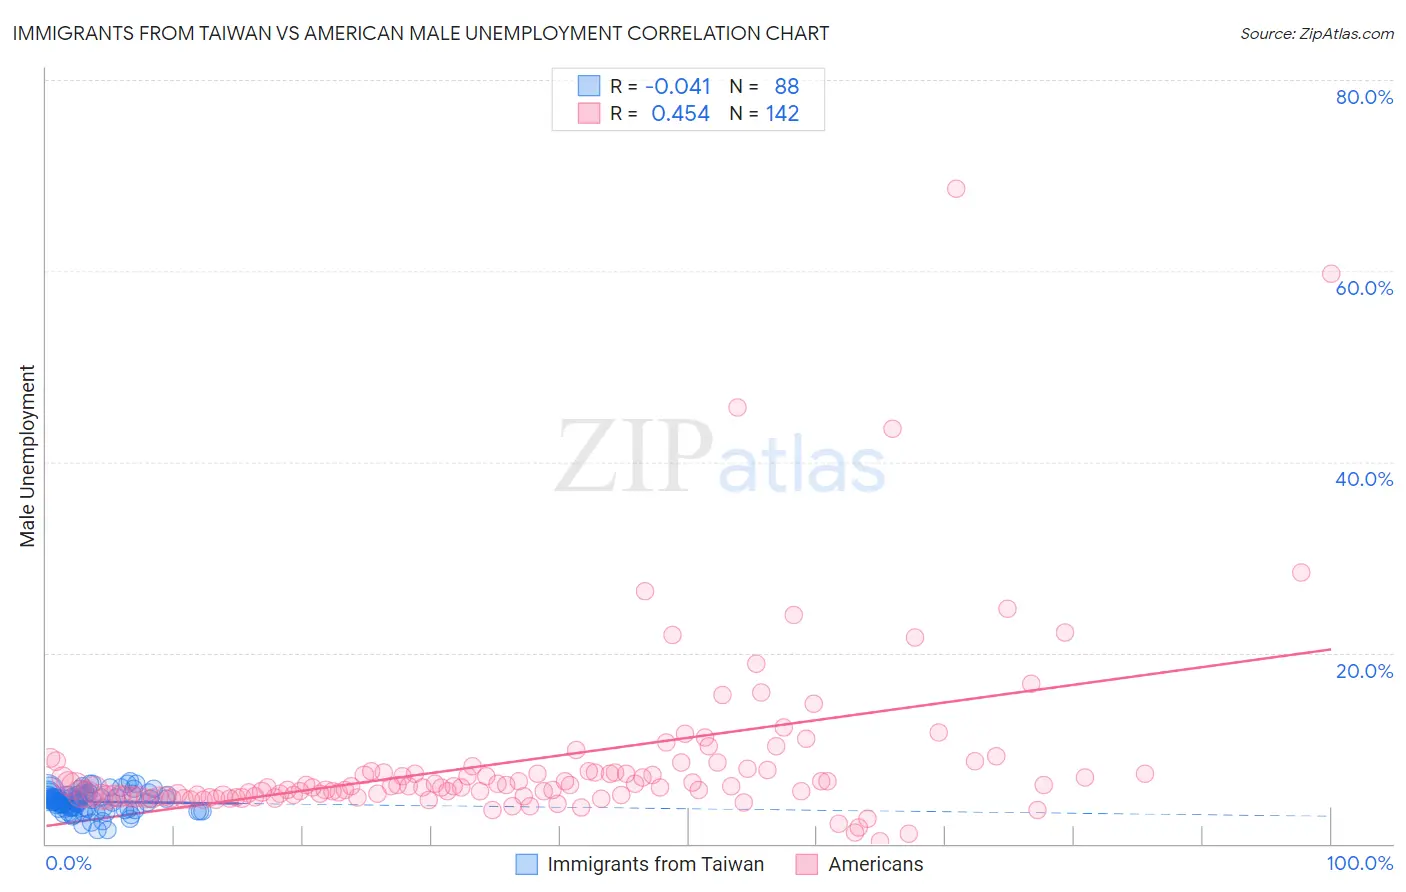
Immigrants from Taiwan vs American Male Unemployment Correlation Chart
The statistical analysis conducted on geographies consisting of 297,680,447 people shows no correlation between the proportion of Immigrants from Taiwan and unemployment rate among males in the United States with a correlation coefficient (R) of -0.041 and weighted average of 4.8%. Similarly, the statistical analysis conducted on geographies consisting of 568,902,342 people shows a moderate positive correlation between the proportion of Americans and unemployment rate among males in the United States with a correlation coefficient (R) of 0.454 and weighted average of 5.2%, a difference of 9.5%.
Male Unemployment Correlation Summary
| Measurement | Immigrants from Taiwan | American |
| Minimum | 1.4% | 0.30% |
| Maximum | 6.5% | 68.6% |
| Range | 5.1% | 68.3% |
| Mean | 4.4% | 8.7% |
| Median | 4.5% | 6.0% |
| Interquartile 25% (IQ1) | 3.7% | 5.0% |
| Interquartile 75% (IQ3) | 5.1% | 7.6% |
| Interquartile Range (IQR) | 1.4% | 2.6% |
| Standard Deviation (Sample) | 1.1% | 9.3% |
| Standard Deviation (Population) | 1.1% | 9.3% |
Similar Demographics by Male Unemployment
Demographics Similar to Immigrants from Taiwan by Male Unemployment
In terms of male unemployment, the demographic groups most similar to Immigrants from Taiwan are Carpatho Rusyn (4.8%, a difference of 0.010%), Tongan (4.8%, a difference of 0.060%), Immigrants from South Central Asia (4.8%, a difference of 0.090%), Pennsylvania German (4.8%, a difference of 0.16%), and Zimbabwean (4.8%, a difference of 0.19%).
| Demographics | Rating | Rank | Male Unemployment |
| Germans | 100.0 /100 | #14 | Exceptional 4.7% |
| Scandinavians | 100.0 /100 | #15 | Exceptional 4.7% |
| Swiss | 99.9 /100 | #16 | Exceptional 4.7% |
| Filipinos | 99.9 /100 | #17 | Exceptional 4.7% |
| English | 99.9 /100 | #18 | Exceptional 4.8% |
| Europeans | 99.9 /100 | #19 | Exceptional 4.8% |
| Pennsylvania Germans | 99.9 /100 | #20 | Exceptional 4.8% |
| Immigrants | Taiwan | 99.9 /100 | #21 | Exceptional 4.8% |
| Carpatho Rusyns | 99.9 /100 | #22 | Exceptional 4.8% |
| Tongans | 99.9 /100 | #23 | Exceptional 4.8% |
| Immigrants | South Central Asia | 99.9 /100 | #24 | Exceptional 4.8% |
| Zimbabweans | 99.9 /100 | #25 | Exceptional 4.8% |
| Dutch | 99.9 /100 | #26 | Exceptional 4.8% |
| Belgians | 99.9 /100 | #27 | Exceptional 4.8% |
| Bulgarians | 99.8 /100 | #28 | Exceptional 4.8% |
Demographics Similar to Americans by Male Unemployment
In terms of male unemployment, the demographic groups most similar to Americans are Immigrants from Northern Africa (5.2%, a difference of 0.030%), Immigrants from Hungary (5.2%, a difference of 0.060%), Immigrants from Indonesia (5.2%, a difference of 0.080%), Immigrants from Uruguay (5.2%, a difference of 0.090%), and Laotian (5.2%, a difference of 0.090%).
| Demographics | Rating | Rank | Male Unemployment |
| Immigrants | Europe | 76.2 /100 | #149 | Good 5.2% |
| Indians (Asian) | 76.0 /100 | #150 | Good 5.2% |
| Slovaks | 75.5 /100 | #151 | Good 5.2% |
| Egyptians | 74.8 /100 | #152 | Good 5.2% |
| Immigrants | Uruguay | 73.9 /100 | #153 | Good 5.2% |
| Laotians | 73.8 /100 | #154 | Good 5.2% |
| Immigrants | Hungary | 73.4 /100 | #155 | Good 5.2% |
| Americans | 72.7 /100 | #156 | Good 5.2% |
| Immigrants | Northern Africa | 72.3 /100 | #157 | Good 5.2% |
| Immigrants | Indonesia | 71.5 /100 | #158 | Good 5.2% |
| Indonesians | 71.2 /100 | #159 | Good 5.2% |
| Immigrants | Norway | 71.0 /100 | #160 | Good 5.2% |
| Immigrants | China | 70.6 /100 | #161 | Good 5.2% |
| Immigrants | Egypt | 65.9 /100 | #162 | Good 5.2% |
| Immigrants | Hong Kong | 65.7 /100 | #163 | Good 5.2% |