Malaysian vs Immigrants from Uzbekistan Unemployment Among Ages 20 to 24 years
COMPARE
Malaysian
Immigrants from Uzbekistan
Unemployment Among Ages 20 to 24 years
Unemployment Among Ages 20 to 24 years Comparison
Malaysians
Immigrants from Uzbekistan
9.8%
UNEMPLOYMENT AMONG AGES 20 TO 24 YEARS
99.5/ 100
METRIC RATING
61st/ 347
METRIC RANK
11.4%
UNEMPLOYMENT AMONG AGES 20 TO 24 YEARS
0.0/ 100
METRIC RATING
271st/ 347
METRIC RANK
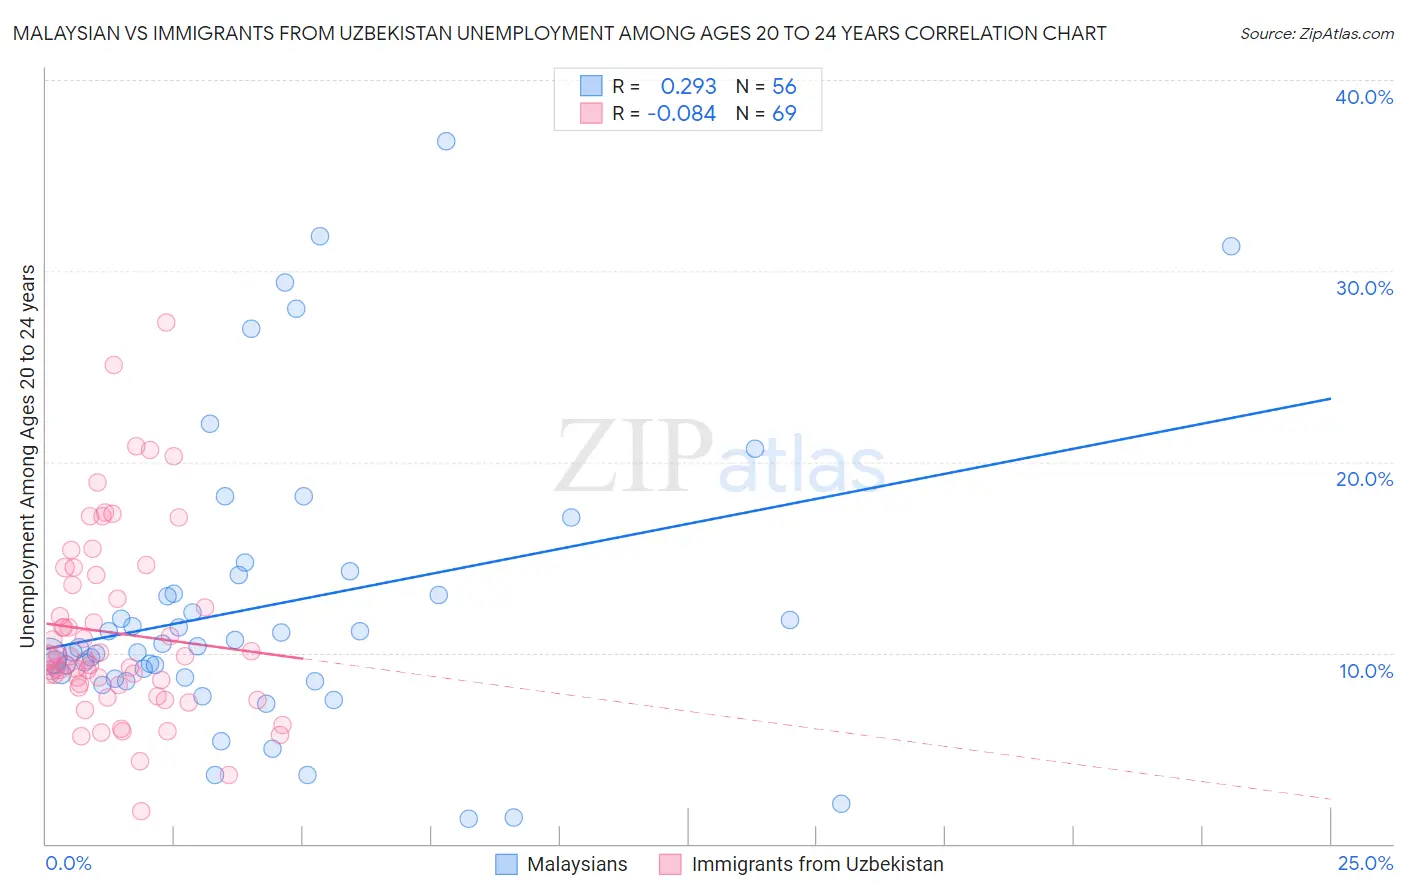
Malaysian vs Immigrants from Uzbekistan Unemployment Among Ages 20 to 24 years Correlation Chart
The statistical analysis conducted on geographies consisting of 222,909,891 people shows a weak positive correlation between the proportion of Malaysians and unemployment rate among population between the ages 20 and 24 in the United States with a correlation coefficient (R) of 0.293 and weighted average of 9.8%. Similarly, the statistical analysis conducted on geographies consisting of 117,531,757 people shows a slight negative correlation between the proportion of Immigrants from Uzbekistan and unemployment rate among population between the ages 20 and 24 in the United States with a correlation coefficient (R) of -0.084 and weighted average of 11.4%, a difference of 16.2%.
Unemployment Among Ages 20 to 24 years Correlation Summary
| Measurement | Malaysian | Immigrants from Uzbekistan |
| Minimum | 1.3% | 1.7% |
| Maximum | 36.8% | 27.3% |
| Range | 35.5% | 25.6% |
| Mean | 12.5% | 11.0% |
| Median | 10.3% | 9.8% |
| Interquartile 25% (IQ1) | 8.7% | 8.2% |
| Interquartile 75% (IQ3) | 13.6% | 13.8% |
| Interquartile Range (IQR) | 4.9% | 5.6% |
| Standard Deviation (Sample) | 7.6% | 4.9% |
| Standard Deviation (Population) | 7.6% | 4.9% |
Similar Demographics by Unemployment Among Ages 20 to 24 years
Demographics Similar to Malaysians by Unemployment Among Ages 20 to 24 years
In terms of unemployment among ages 20 to 24 years, the demographic groups most similar to Malaysians are Immigrants from Kuwait (9.8%, a difference of 0.020%), Pakistani (9.8%, a difference of 0.050%), English (9.8%, a difference of 0.050%), Immigrants from Moldova (9.8%, a difference of 0.10%), and Immigrants from Singapore (9.8%, a difference of 0.10%).
| Demographics | Rating | Rank | Unemployment Among Ages 20 to 24 years |
| Immigrants | Cambodia | 99.6 /100 | #54 | Exceptional 9.8% |
| Carpatho Rusyns | 99.6 /100 | #55 | Exceptional 9.8% |
| Nicaraguans | 99.6 /100 | #56 | Exceptional 9.8% |
| Immigrants | Moldova | 99.5 /100 | #57 | Exceptional 9.8% |
| Pakistanis | 99.5 /100 | #58 | Exceptional 9.8% |
| English | 99.5 /100 | #59 | Exceptional 9.8% |
| Immigrants | Kuwait | 99.5 /100 | #60 | Exceptional 9.8% |
| Malaysians | 99.5 /100 | #61 | Exceptional 9.8% |
| Immigrants | Singapore | 99.4 /100 | #62 | Exceptional 9.8% |
| British | 99.4 /100 | #63 | Exceptional 9.8% |
| Serbians | 99.4 /100 | #64 | Exceptional 9.8% |
| Welsh | 99.3 /100 | #65 | Exceptional 9.8% |
| Scottish | 99.3 /100 | #66 | Exceptional 9.8% |
| Immigrants | Bolivia | 99.2 /100 | #67 | Exceptional 9.9% |
| Mongolians | 99.1 /100 | #68 | Exceptional 9.9% |
Demographics Similar to Immigrants from Uzbekistan by Unemployment Among Ages 20 to 24 years
In terms of unemployment among ages 20 to 24 years, the demographic groups most similar to Immigrants from Uzbekistan are Nigerian (11.4%, a difference of 0.030%), Immigrants from Nigeria (11.5%, a difference of 0.64%), Cape Verdean (11.5%, a difference of 0.72%), Senegalese (11.5%, a difference of 1.1%), and Delaware (11.3%, a difference of 1.1%).
| Demographics | Rating | Rank | Unemployment Among Ages 20 to 24 years |
| Sub-Saharan Africans | 0.0 /100 | #264 | Tragic 11.1% |
| Immigrants | Ireland | 0.0 /100 | #265 | Tragic 11.1% |
| Immigrants | Liberia | 0.0 /100 | #266 | Tragic 11.1% |
| Immigrants | Greece | 0.0 /100 | #267 | Tragic 11.1% |
| Maltese | 0.0 /100 | #268 | Tragic 11.2% |
| Ute | 0.0 /100 | #269 | Tragic 11.2% |
| Delaware | 0.0 /100 | #270 | Tragic 11.3% |
| Immigrants | Uzbekistan | 0.0 /100 | #271 | Tragic 11.4% |
| Nigerians | 0.0 /100 | #272 | Tragic 11.4% |
| Immigrants | Nigeria | 0.0 /100 | #273 | Tragic 11.5% |
| Cape Verdeans | 0.0 /100 | #274 | Tragic 11.5% |
| Senegalese | 0.0 /100 | #275 | Tragic 11.5% |
| Sierra Leoneans | 0.0 /100 | #276 | Tragic 11.5% |
| Africans | 0.0 /100 | #277 | Tragic 11.5% |
| Colville | 0.0 /100 | #278 | Tragic 11.6% |