Immigrants from Armenia vs Houma Unemployment Among Ages 45 to 54 years
COMPARE
Immigrants from Armenia
Houma
Unemployment Among Ages 45 to 54 years
Unemployment Among Ages 45 to 54 years Comparison
Immigrants from Armenia
Houma
6.1%
UNEMPLOYMENT AMONG AGES 45 TO 54 YEARS
0.0/ 100
METRIC RATING
325th/ 347
METRIC RANK
5.6%
UNEMPLOYMENT AMONG AGES 45 TO 54 YEARS
0.0/ 100
METRIC RATING
317th/ 347
METRIC RANK
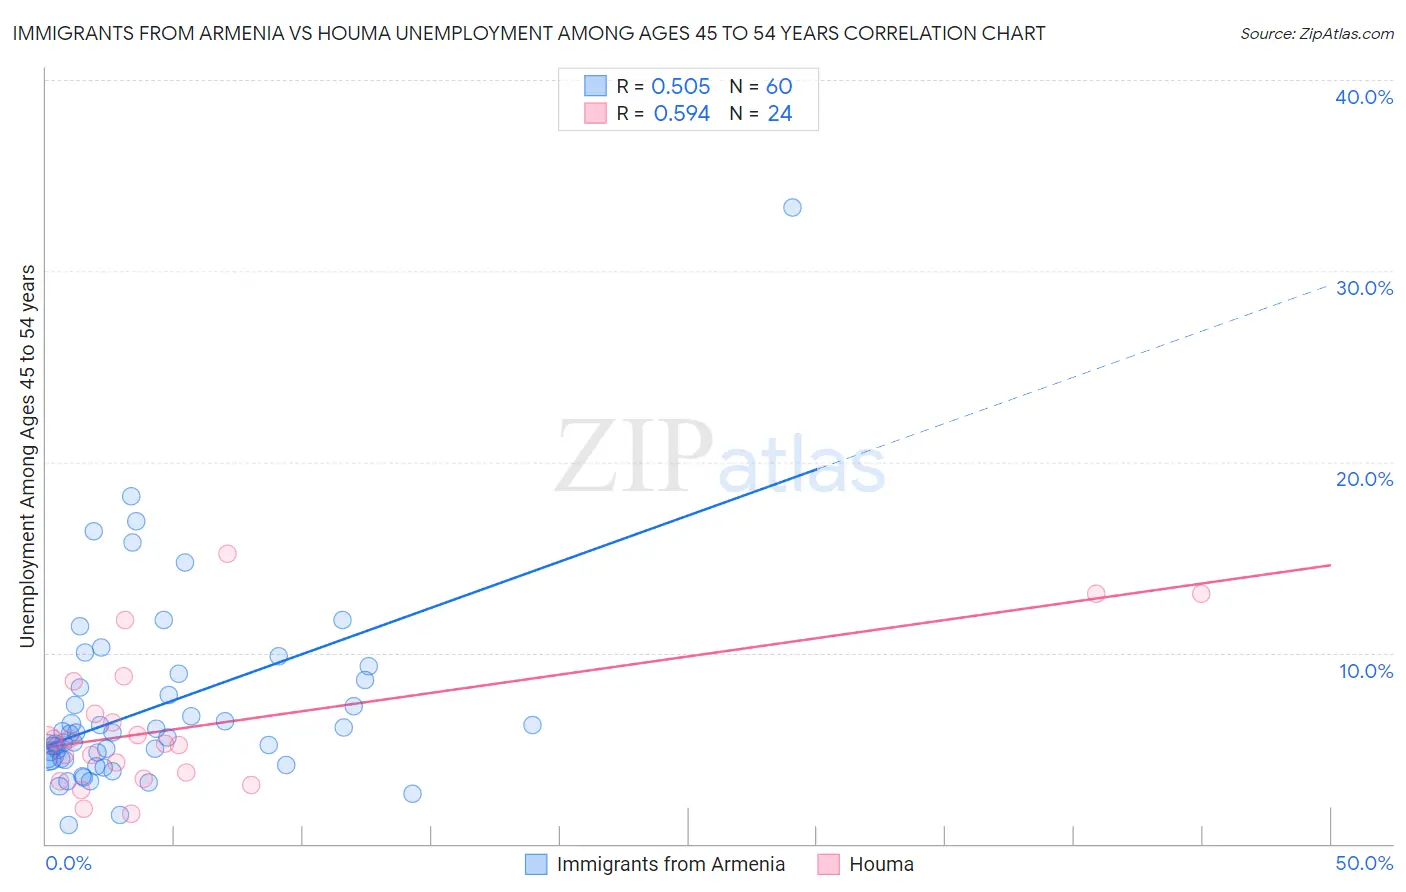
Immigrants from Armenia vs Houma Unemployment Among Ages 45 to 54 years Correlation Chart
The statistical analysis conducted on geographies consisting of 97,342,787 people shows a substantial positive correlation between the proportion of Immigrants from Armenia and unemployment rate among population between the ages 45 and 54 in the United States with a correlation coefficient (R) of 0.505 and weighted average of 6.1%. Similarly, the statistical analysis conducted on geographies consisting of 36,494,727 people shows a substantial positive correlation between the proportion of Houma and unemployment rate among population between the ages 45 and 54 in the United States with a correlation coefficient (R) of 0.594 and weighted average of 5.6%, a difference of 8.9%.
Unemployment Among Ages 45 to 54 years Correlation Summary
| Measurement | Immigrants from Armenia | Houma |
| Minimum | 1.0% | 1.6% |
| Maximum | 33.3% | 15.2% |
| Range | 32.3% | 13.6% |
| Mean | 7.2% | 6.2% |
| Median | 5.6% | 5.3% |
| Interquartile 25% (IQ1) | 4.4% | 3.5% |
| Interquartile 75% (IQ3) | 8.4% | 7.6% |
| Interquartile Range (IQR) | 4.0% | 4.1% |
| Standard Deviation (Sample) | 5.1% | 3.7% |
| Standard Deviation (Population) | 5.1% | 3.6% |
Demographics Similar to Immigrants from Armenia and Houma by Unemployment Among Ages 45 to 54 years
In terms of unemployment among ages 45 to 54 years, the demographic groups most similar to Immigrants from Armenia are Ute (6.2%, a difference of 0.84%), Dominican (6.2%, a difference of 1.1%), Pueblo (6.2%, a difference of 1.3%), Native/Alaskan (6.1%, a difference of 1.3%), and Alaska Native (6.3%, a difference of 2.0%). Similarly, the demographic groups most similar to Houma are Immigrants from Guyana (5.6%, a difference of 0.10%), Immigrants from Dominica (5.6%, a difference of 0.30%), Guyanese (5.6%, a difference of 0.48%), British West Indian (5.7%, a difference of 0.63%), and Shoshone (5.6%, a difference of 0.81%).
| Demographics | Rating | Rank | Unemployment Among Ages 45 to 54 years |
| Chippewa | 0.0 /100 | #311 | Tragic 5.5% |
| Immigrants | Grenada | 0.0 /100 | #312 | Tragic 5.6% |
| Shoshone | 0.0 /100 | #313 | Tragic 5.6% |
| Guyanese | 0.0 /100 | #314 | Tragic 5.6% |
| Immigrants | Dominica | 0.0 /100 | #315 | Tragic 5.6% |
| Immigrants | Guyana | 0.0 /100 | #316 | Tragic 5.6% |
| Houma | 0.0 /100 | #317 | Tragic 5.6% |
| British West Indians | 0.0 /100 | #318 | Tragic 5.7% |
| Cape Verdeans | 0.0 /100 | #319 | Tragic 5.7% |
| Immigrants | St. Vincent and the Grenadines | 0.0 /100 | #320 | Tragic 5.7% |
| Yakama | 0.0 /100 | #321 | Tragic 5.7% |
| Immigrants | Azores | 0.0 /100 | #322 | Tragic 5.7% |
| Immigrants | Cabo Verde | 0.0 /100 | #323 | Tragic 5.9% |
| Natives/Alaskans | 0.0 /100 | #324 | Tragic 6.1% |
| Immigrants | Armenia | 0.0 /100 | #325 | Tragic 6.1% |
| Ute | 0.0 /100 | #326 | Tragic 6.2% |
| Dominicans | 0.0 /100 | #327 | Tragic 6.2% |
| Pueblo | 0.0 /100 | #328 | Tragic 6.2% |
| Alaska Natives | 0.0 /100 | #329 | Tragic 6.3% |
| Immigrants | Dominican Republic | 0.0 /100 | #330 | Tragic 6.3% |
| Tohono O'odham | 0.0 /100 | #331 | Tragic 6.3% |