Immigrants from Armenia vs West Indian Unemployment Among Ages 45 to 54 years
COMPARE
Immigrants from Armenia
West Indian
Unemployment Among Ages 45 to 54 years
Unemployment Among Ages 45 to 54 years Comparison
Immigrants from Armenia
West Indians
6.1%
UNEMPLOYMENT AMONG AGES 45 TO 54 YEARS
0.0/ 100
METRIC RATING
325th/ 347
METRIC RANK
5.3%
UNEMPLOYMENT AMONG AGES 45 TO 54 YEARS
0.0/ 100
METRIC RATING
297th/ 347
METRIC RANK
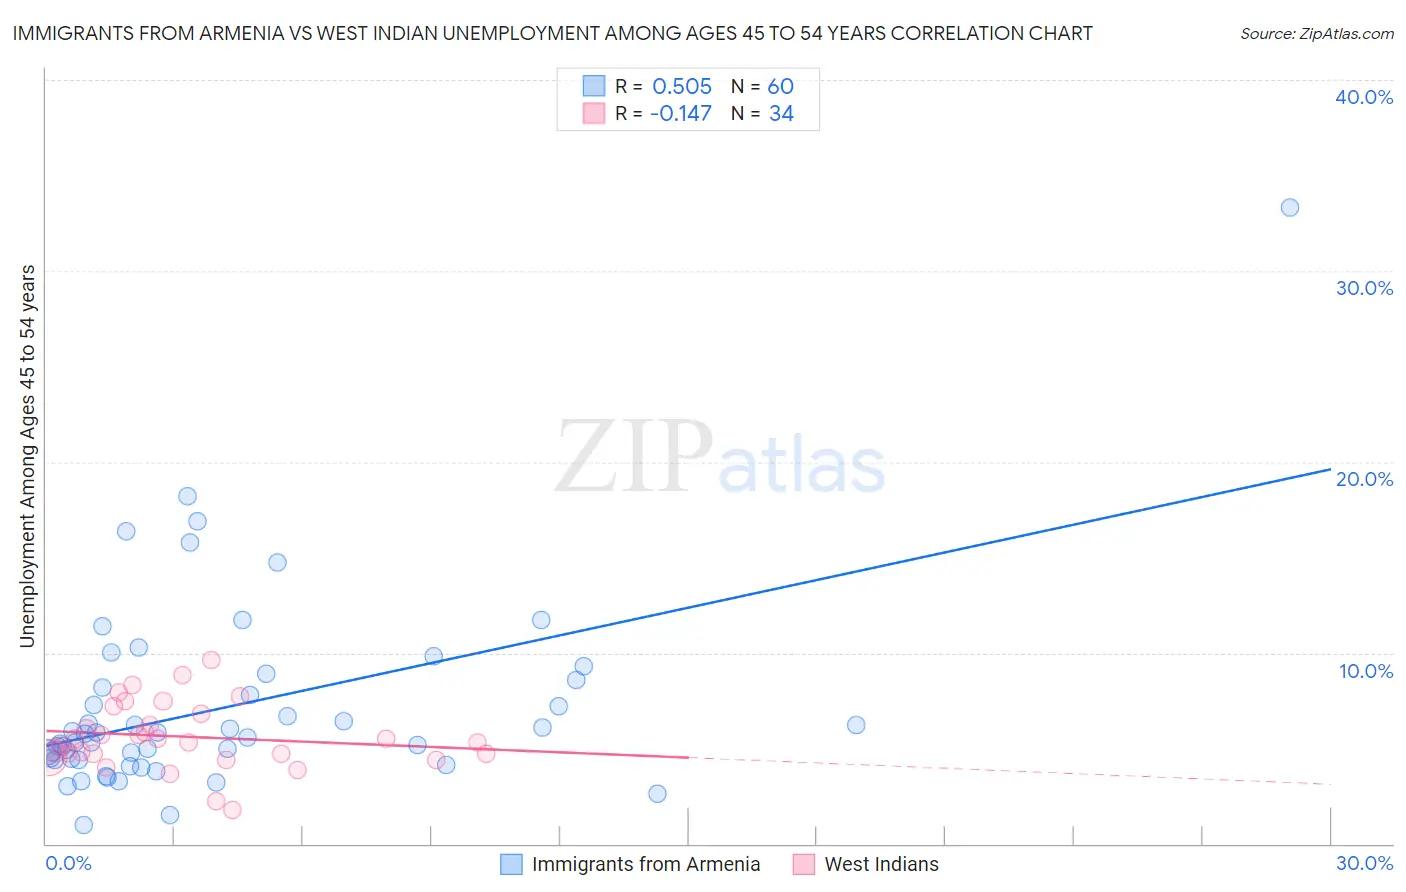
Immigrants from Armenia vs West Indian Unemployment Among Ages 45 to 54 years Correlation Chart
The statistical analysis conducted on geographies consisting of 97,342,787 people shows a substantial positive correlation between the proportion of Immigrants from Armenia and unemployment rate among population between the ages 45 and 54 in the United States with a correlation coefficient (R) of 0.505 and weighted average of 6.1%. Similarly, the statistical analysis conducted on geographies consisting of 250,886,233 people shows a poor negative correlation between the proportion of West Indians and unemployment rate among population between the ages 45 and 54 in the United States with a correlation coefficient (R) of -0.147 and weighted average of 5.3%, a difference of 16.6%.
Unemployment Among Ages 45 to 54 years Correlation Summary
| Measurement | Immigrants from Armenia | West Indian |
| Minimum | 1.0% | 1.8% |
| Maximum | 33.3% | 9.6% |
| Range | 32.3% | 7.8% |
| Mean | 7.2% | 5.6% |
| Median | 5.6% | 5.4% |
| Interquartile 25% (IQ1) | 4.4% | 4.7% |
| Interquartile 75% (IQ3) | 8.4% | 6.8% |
| Interquartile Range (IQR) | 4.0% | 2.1% |
| Standard Deviation (Sample) | 5.1% | 1.7% |
| Standard Deviation (Population) | 5.1% | 1.7% |
Similar Demographics by Unemployment Among Ages 45 to 54 years
Demographics Similar to Immigrants from Armenia by Unemployment Among Ages 45 to 54 years
In terms of unemployment among ages 45 to 54 years, the demographic groups most similar to Immigrants from Armenia are Ute (6.2%, a difference of 0.84%), Dominican (6.2%, a difference of 1.1%), Pueblo (6.2%, a difference of 1.3%), Native/Alaskan (6.1%, a difference of 1.3%), and Alaska Native (6.3%, a difference of 2.0%).
| Demographics | Rating | Rank | Unemployment Among Ages 45 to 54 years |
| British West Indians | 0.0 /100 | #318 | Tragic 5.7% |
| Cape Verdeans | 0.0 /100 | #319 | Tragic 5.7% |
| Immigrants | St. Vincent and the Grenadines | 0.0 /100 | #320 | Tragic 5.7% |
| Yakama | 0.0 /100 | #321 | Tragic 5.7% |
| Immigrants | Azores | 0.0 /100 | #322 | Tragic 5.7% |
| Immigrants | Cabo Verde | 0.0 /100 | #323 | Tragic 5.9% |
| Natives/Alaskans | 0.0 /100 | #324 | Tragic 6.1% |
| Immigrants | Armenia | 0.0 /100 | #325 | Tragic 6.1% |
| Ute | 0.0 /100 | #326 | Tragic 6.2% |
| Dominicans | 0.0 /100 | #327 | Tragic 6.2% |
| Pueblo | 0.0 /100 | #328 | Tragic 6.2% |
| Alaska Natives | 0.0 /100 | #329 | Tragic 6.3% |
| Immigrants | Dominican Republic | 0.0 /100 | #330 | Tragic 6.3% |
| Tohono O'odham | 0.0 /100 | #331 | Tragic 6.3% |
| Pima | 0.0 /100 | #332 | Tragic 6.4% |
Demographics Similar to West Indians by Unemployment Among Ages 45 to 54 years
In terms of unemployment among ages 45 to 54 years, the demographic groups most similar to West Indians are Aleut (5.3%, a difference of 0.0%), Immigrants from Trinidad and Tobago (5.3%, a difference of 0.12%), Ecuadorian (5.3%, a difference of 0.14%), Jamaican (5.3%, a difference of 0.19%), and Belizean (5.2%, a difference of 0.34%).
| Demographics | Rating | Rank | Unemployment Among Ages 45 to 54 years |
| Immigrants | Portugal | 0.0 /100 | #290 | Tragic 5.2% |
| Armenians | 0.0 /100 | #291 | Tragic 5.2% |
| Trinidadians and Tobagonians | 0.0 /100 | #292 | Tragic 5.2% |
| Immigrants | Senegal | 0.0 /100 | #293 | Tragic 5.2% |
| Belizeans | 0.0 /100 | #294 | Tragic 5.2% |
| Jamaicans | 0.0 /100 | #295 | Tragic 5.3% |
| Aleuts | 0.0 /100 | #296 | Tragic 5.3% |
| West Indians | 0.0 /100 | #297 | Tragic 5.3% |
| Immigrants | Trinidad and Tobago | 0.0 /100 | #298 | Tragic 5.3% |
| Ecuadorians | 0.0 /100 | #299 | Tragic 5.3% |
| Central American Indians | 0.0 /100 | #300 | Tragic 5.3% |
| Menominee | 0.0 /100 | #301 | Tragic 5.3% |
| Immigrants | Ecuador | 0.0 /100 | #302 | Tragic 5.3% |
| Immigrants | Belize | 0.0 /100 | #303 | Tragic 5.3% |
| Immigrants | Jamaica | 0.0 /100 | #304 | Tragic 5.4% |