Immigrants from Albania vs Immigrants from Barbados Unemployment Among Women with Children Under 6 years
COMPARE
Immigrants from Albania
Immigrants from Barbados
Unemployment Among Women with Children Under 6 years
Unemployment Among Women with Children Under 6 years Comparison
Immigrants from Albania
Immigrants from Barbados
7.1%
UNEMPLOYMENT AMONG WOMEN WITH CHILDREN UNDER 6 YEARS
98.7/ 100
METRIC RATING
84th/ 347
METRIC RANK
8.0%
UNEMPLOYMENT AMONG WOMEN WITH CHILDREN UNDER 6 YEARS
4.2/ 100
METRIC RATING
236th/ 347
METRIC RANK
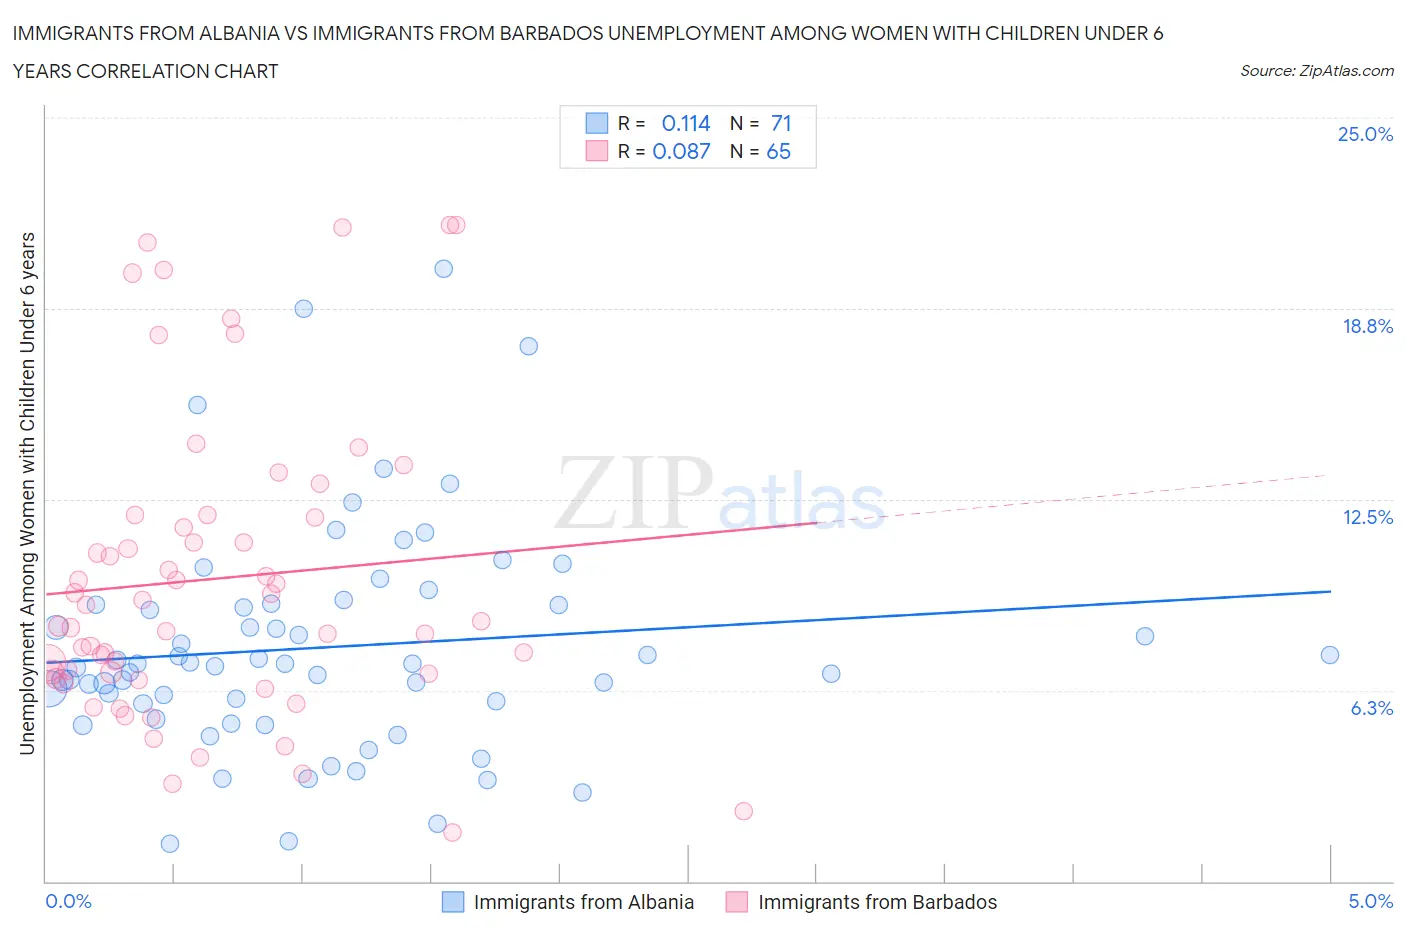
Immigrants from Albania vs Immigrants from Barbados Unemployment Among Women with Children Under 6 years Correlation Chart
The statistical analysis conducted on geographies consisting of 102,982,733 people shows a poor positive correlation between the proportion of Immigrants from Albania and unemployment rate among women with children under the age of 6 in the United States with a correlation coefficient (R) of 0.114 and weighted average of 7.1%. Similarly, the statistical analysis conducted on geographies consisting of 101,537,844 people shows a slight positive correlation between the proportion of Immigrants from Barbados and unemployment rate among women with children under the age of 6 in the United States with a correlation coefficient (R) of 0.087 and weighted average of 8.0%, a difference of 13.3%.
Unemployment Among Women with Children Under 6 years Correlation Summary
| Measurement | Immigrants from Albania | Immigrants from Barbados |
| Minimum | 1.2% | 1.6% |
| Maximum | 20.1% | 21.5% |
| Range | 18.8% | 19.9% |
| Mean | 7.7% | 9.9% |
| Median | 7.1% | 8.5% |
| Interquartile 25% (IQ1) | 5.8% | 6.7% |
| Interquartile 75% (IQ3) | 9.1% | 11.9% |
| Interquartile Range (IQR) | 3.2% | 5.2% |
| Standard Deviation (Sample) | 3.6% | 4.9% |
| Standard Deviation (Population) | 3.6% | 4.9% |
Similar Demographics by Unemployment Among Women with Children Under 6 years
Demographics Similar to Immigrants from Albania by Unemployment Among Women with Children Under 6 years
In terms of unemployment among women with children under 6 years, the demographic groups most similar to Immigrants from Albania are Immigrants from Romania (7.1%, a difference of 0.040%), Egyptian (7.1%, a difference of 0.050%), Immigrants from Afghanistan (7.1%, a difference of 0.080%), Immigrants from Zimbabwe (7.1%, a difference of 0.16%), and Immigrants from Venezuela (7.1%, a difference of 0.23%).
| Demographics | Rating | Rank | Unemployment Among Women with Children Under 6 years |
| Immigrants | Croatia | 98.9 /100 | #77 | Exceptional 7.1% |
| Immigrants | Somalia | 98.9 /100 | #78 | Exceptional 7.1% |
| Immigrants | Fiji | 98.9 /100 | #79 | Exceptional 7.1% |
| Immigrants | Greece | 98.9 /100 | #80 | Exceptional 7.1% |
| Immigrants | Venezuela | 98.8 /100 | #81 | Exceptional 7.1% |
| Immigrants | Afghanistan | 98.7 /100 | #82 | Exceptional 7.1% |
| Egyptians | 98.7 /100 | #83 | Exceptional 7.1% |
| Immigrants | Albania | 98.7 /100 | #84 | Exceptional 7.1% |
| Immigrants | Romania | 98.7 /100 | #85 | Exceptional 7.1% |
| Immigrants | Zimbabwe | 98.6 /100 | #86 | Exceptional 7.1% |
| Alsatians | 98.4 /100 | #87 | Exceptional 7.1% |
| Immigrants | Hungary | 98.3 /100 | #88 | Exceptional 7.1% |
| Immigrants | Denmark | 98.3 /100 | #89 | Exceptional 7.1% |
| Immigrants | Spain | 98.2 /100 | #90 | Exceptional 7.1% |
| Danes | 98.2 /100 | #91 | Exceptional 7.1% |
Demographics Similar to Immigrants from Barbados by Unemployment Among Women with Children Under 6 years
In terms of unemployment among women with children under 6 years, the demographic groups most similar to Immigrants from Barbados are Comanche (8.0%, a difference of 0.020%), Kiowa (8.0%, a difference of 0.050%), Immigrants from Costa Rica (8.0%, a difference of 0.060%), Immigrants from Trinidad and Tobago (8.0%, a difference of 0.20%), and Welsh (8.0%, a difference of 0.29%).
| Demographics | Rating | Rank | Unemployment Among Women with Children Under 6 years |
| Salvadorans | 5.5 /100 | #229 | Tragic 8.0% |
| Finns | 5.3 /100 | #230 | Tragic 8.0% |
| Trinidadians and Tobagonians | 5.3 /100 | #231 | Tragic 8.0% |
| Welsh | 5.0 /100 | #232 | Tragic 8.0% |
| Immigrants | Trinidad and Tobago | 4.8 /100 | #233 | Tragic 8.0% |
| Kiowa | 4.4 /100 | #234 | Tragic 8.0% |
| Comanche | 4.3 /100 | #235 | Tragic 8.0% |
| Immigrants | Barbados | 4.2 /100 | #236 | Tragic 8.0% |
| Immigrants | Costa Rica | 4.1 /100 | #237 | Tragic 8.0% |
| Immigrants | Middle Africa | 3.2 /100 | #238 | Tragic 8.1% |
| Irish | 2.7 /100 | #239 | Tragic 8.1% |
| Immigrants | El Salvador | 2.6 /100 | #240 | Tragic 8.1% |
| Liberians | 2.6 /100 | #241 | Tragic 8.1% |
| Dutch | 2.5 /100 | #242 | Tragic 8.1% |
| Hawaiians | 1.8 /100 | #243 | Tragic 8.2% |