Immigrants from Albania vs Immigrants from Barbados In Labor Force | Age 30-34
COMPARE
Immigrants from Albania
Immigrants from Barbados
In Labor Force | Age 30-34
In Labor Force | Age 30-34 Comparison
Immigrants from Albania
Immigrants from Barbados
86.1%
IN LABOR FORCE | AGE 30-34
100.0/ 100
METRIC RATING
15th/ 347
METRIC RANK
84.0%
IN LABOR FORCE | AGE 30-34
1.4/ 100
METRIC RATING
238th/ 347
METRIC RANK
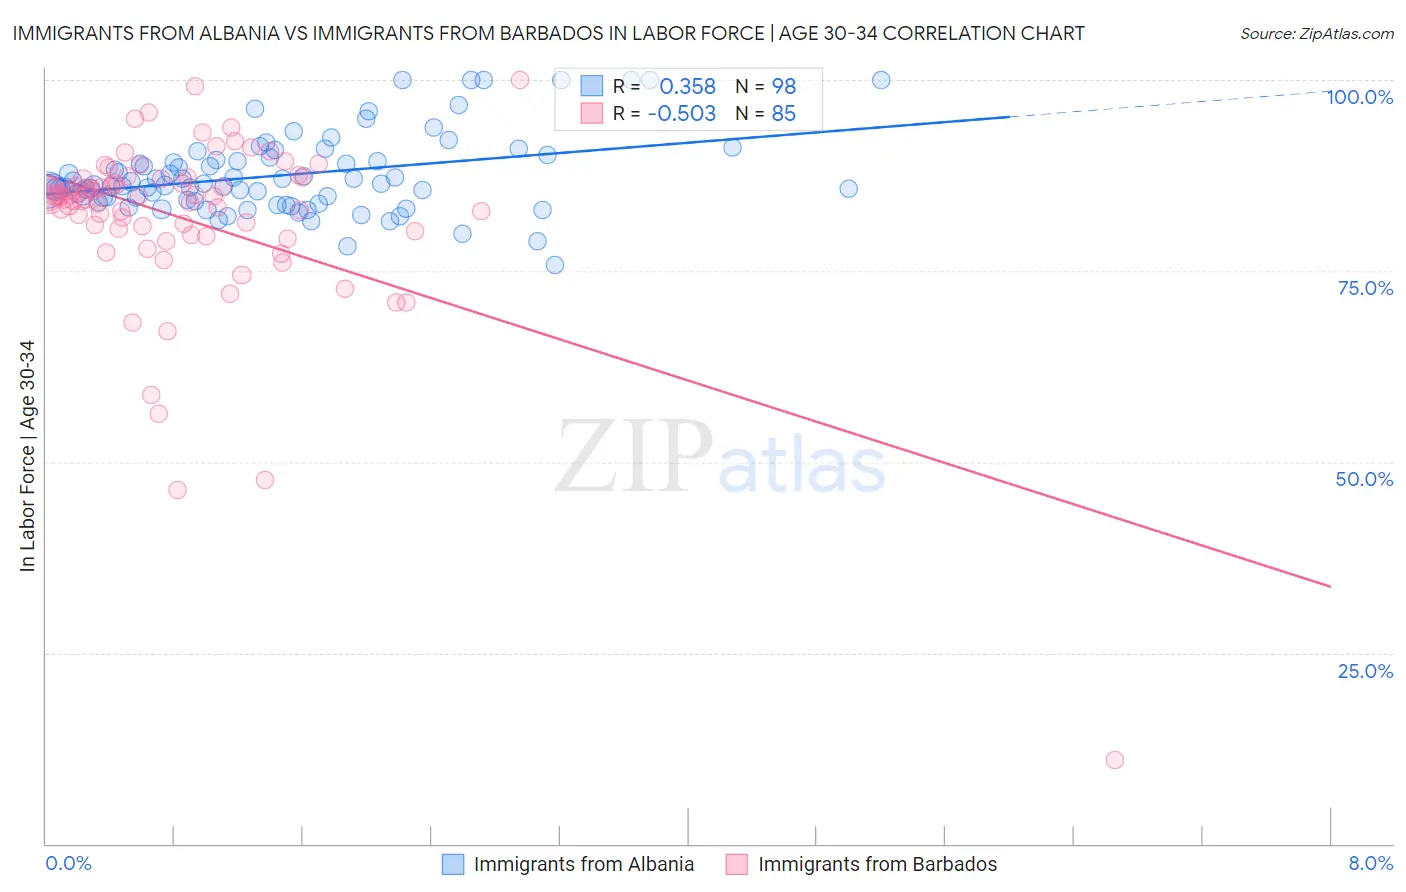
Immigrants from Albania vs Immigrants from Barbados In Labor Force | Age 30-34 Correlation Chart
The statistical analysis conducted on geographies consisting of 119,375,013 people shows a mild positive correlation between the proportion of Immigrants from Albania and labor force participation rate among population between the ages 30 and 34 in the United States with a correlation coefficient (R) of 0.358 and weighted average of 86.1%. Similarly, the statistical analysis conducted on geographies consisting of 112,774,912 people shows a substantial negative correlation between the proportion of Immigrants from Barbados and labor force participation rate among population between the ages 30 and 34 in the United States with a correlation coefficient (R) of -0.503 and weighted average of 84.0%, a difference of 2.4%.
In Labor Force | Age 30-34 Correlation Summary
| Measurement | Immigrants from Albania | Immigrants from Barbados |
| Minimum | 75.7% | 10.9% |
| Maximum | 100.0% | 100.0% |
| Range | 24.3% | 89.1% |
| Mean | 87.5% | 81.8% |
| Median | 86.2% | 84.6% |
| Interquartile 25% (IQ1) | 84.3% | 79.9% |
| Interquartile 75% (IQ3) | 89.6% | 87.0% |
| Interquartile Range (IQR) | 5.3% | 7.1% |
| Standard Deviation (Sample) | 5.1% | 12.0% |
| Standard Deviation (Population) | 5.1% | 11.9% |
Similar Demographics by In Labor Force | Age 30-34
Demographics Similar to Immigrants from Albania by In Labor Force | Age 30-34
In terms of in labor force | age 30-34, the demographic groups most similar to Immigrants from Albania are Immigrants from Cabo Verde (86.1%, a difference of 0.010%), Bolivian (86.1%, a difference of 0.030%), Immigrants from Croatia (86.1%, a difference of 0.030%), Latvian (86.0%, a difference of 0.030%), and Immigrants from Cameroon (86.0%, a difference of 0.040%).
| Demographics | Rating | Rank | In Labor Force | Age 30-34 |
| Cambodians | 100.0 /100 | #8 | Exceptional 86.2% |
| Immigrants | Somalia | 100.0 /100 | #9 | Exceptional 86.2% |
| Immigrants | Serbia | 100.0 /100 | #10 | Exceptional 86.2% |
| Carpatho Rusyns | 100.0 /100 | #11 | Exceptional 86.2% |
| Bolivians | 100.0 /100 | #12 | Exceptional 86.1% |
| Immigrants | Croatia | 100.0 /100 | #13 | Exceptional 86.1% |
| Immigrants | Cabo Verde | 100.0 /100 | #14 | Exceptional 86.1% |
| Immigrants | Albania | 100.0 /100 | #15 | Exceptional 86.1% |
| Latvians | 100.0 /100 | #16 | Exceptional 86.0% |
| Immigrants | Cameroon | 100.0 /100 | #17 | Exceptional 86.0% |
| Immigrants | Sierra Leone | 100.0 /100 | #18 | Exceptional 86.0% |
| Sierra Leoneans | 100.0 /100 | #19 | Exceptional 86.0% |
| Bulgarians | 100.0 /100 | #20 | Exceptional 86.0% |
| Immigrants | Bulgaria | 100.0 /100 | #21 | Exceptional 86.0% |
| Bermudans | 100.0 /100 | #22 | Exceptional 85.9% |
Demographics Similar to Immigrants from Barbados by In Labor Force | Age 30-34
In terms of in labor force | age 30-34, the demographic groups most similar to Immigrants from Barbados are Celtic (84.1%, a difference of 0.0%), English (84.0%, a difference of 0.0%), Venezuelan (84.0%, a difference of 0.010%), U.S. Virgin Islander (84.1%, a difference of 0.020%), and French American Indian (84.1%, a difference of 0.030%).
| Demographics | Rating | Rank | In Labor Force | Age 30-34 |
| Malaysians | 2.2 /100 | #231 | Tragic 84.1% |
| Immigrants | Immigrants | 2.0 /100 | #232 | Tragic 84.1% |
| West Indians | 1.9 /100 | #233 | Tragic 84.1% |
| Haitians | 1.8 /100 | #234 | Tragic 84.1% |
| French American Indians | 1.7 /100 | #235 | Tragic 84.1% |
| U.S. Virgin Islanders | 1.5 /100 | #236 | Tragic 84.1% |
| Celtics | 1.4 /100 | #237 | Tragic 84.1% |
| Immigrants | Barbados | 1.4 /100 | #238 | Tragic 84.0% |
| English | 1.4 /100 | #239 | Tragic 84.0% |
| Venezuelans | 1.3 /100 | #240 | Tragic 84.0% |
| Immigrants | Portugal | 1.2 /100 | #241 | Tragic 84.0% |
| Immigrants | Oceania | 1.1 /100 | #242 | Tragic 84.0% |
| Immigrants | Caribbean | 1.1 /100 | #243 | Tragic 84.0% |
| Basques | 0.9 /100 | #244 | Tragic 84.0% |
| Immigrants | Venezuela | 0.9 /100 | #245 | Tragic 84.0% |