Burmese vs Immigrants from Barbados Unemployment Among Women with Children Under 6 years
COMPARE
Burmese
Immigrants from Barbados
Unemployment Among Women with Children Under 6 years
Unemployment Among Women with Children Under 6 years Comparison
Burmese
Immigrants from Barbados
6.5%
UNEMPLOYMENT AMONG WOMEN WITH CHILDREN UNDER 6 YEARS
100.0/ 100
METRIC RATING
21st/ 347
METRIC RANK
8.0%
UNEMPLOYMENT AMONG WOMEN WITH CHILDREN UNDER 6 YEARS
4.2/ 100
METRIC RATING
236th/ 347
METRIC RANK
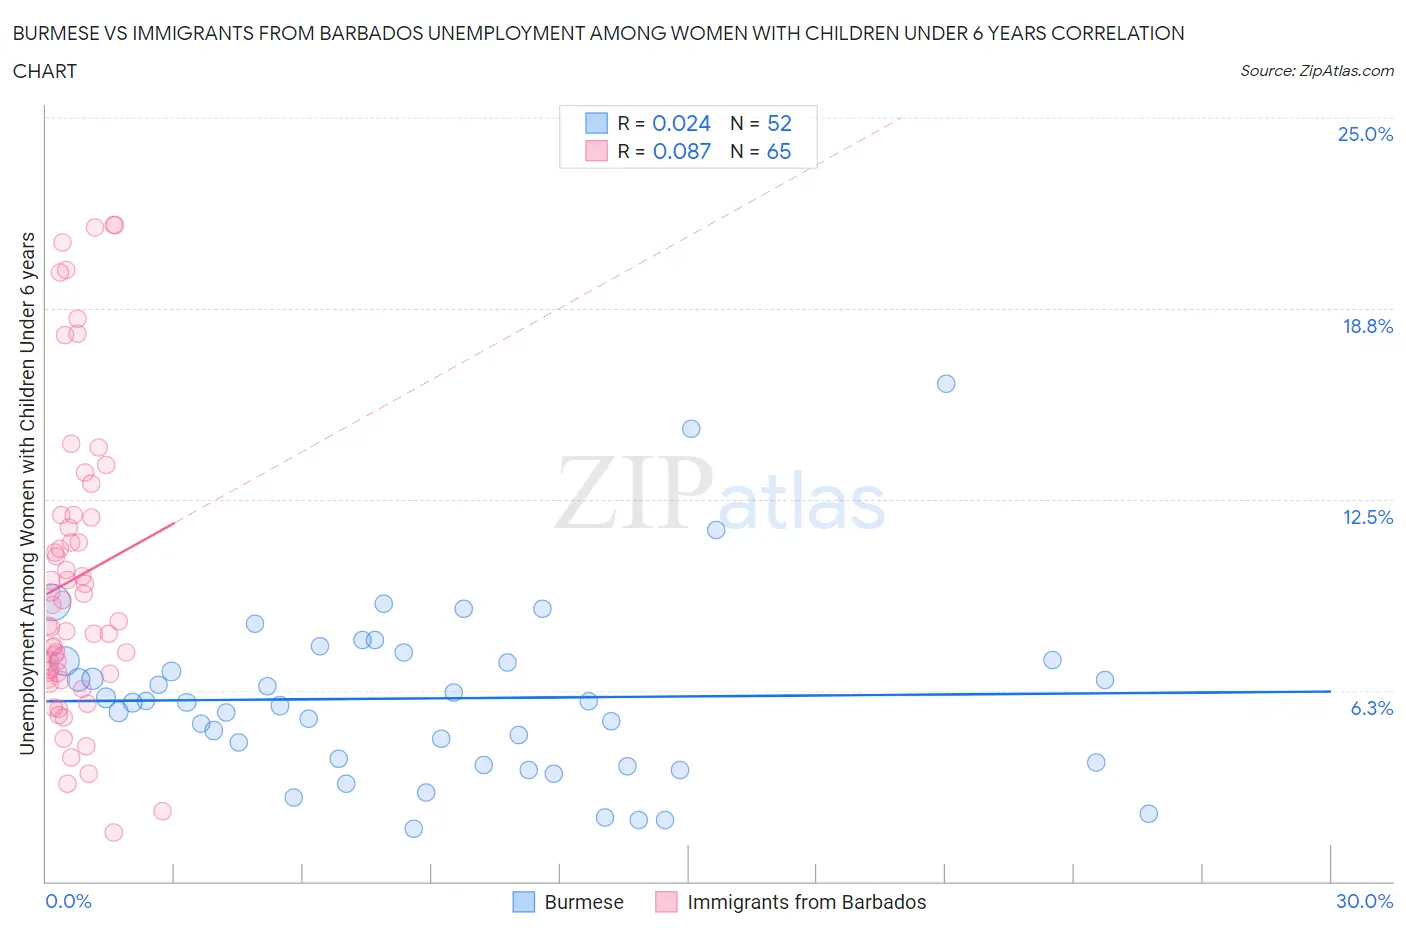
Burmese vs Immigrants from Barbados Unemployment Among Women with Children Under 6 years Correlation Chart
The statistical analysis conducted on geographies consisting of 339,459,129 people shows no correlation between the proportion of Burmese and unemployment rate among women with children under the age of 6 in the United States with a correlation coefficient (R) of 0.024 and weighted average of 6.5%. Similarly, the statistical analysis conducted on geographies consisting of 101,537,844 people shows a slight positive correlation between the proportion of Immigrants from Barbados and unemployment rate among women with children under the age of 6 in the United States with a correlation coefficient (R) of 0.087 and weighted average of 8.0%, a difference of 24.1%.
Unemployment Among Women with Children Under 6 years Correlation Summary
| Measurement | Burmese | Immigrants from Barbados |
| Minimum | 1.7% | 1.6% |
| Maximum | 16.3% | 21.5% |
| Range | 14.6% | 19.9% |
| Mean | 6.0% | 9.9% |
| Median | 5.9% | 8.5% |
| Interquartile 25% (IQ1) | 3.8% | 6.7% |
| Interquartile 75% (IQ3) | 7.2% | 11.9% |
| Interquartile Range (IQR) | 3.4% | 5.2% |
| Standard Deviation (Sample) | 2.9% | 4.9% |
| Standard Deviation (Population) | 2.9% | 4.9% |
Similar Demographics by Unemployment Among Women with Children Under 6 years
Demographics Similar to Burmese by Unemployment Among Women with Children Under 6 years
In terms of unemployment among women with children under 6 years, the demographic groups most similar to Burmese are Ute (6.5%, a difference of 0.050%), Mongolian (6.5%, a difference of 0.10%), Immigrants from Korea (6.5%, a difference of 0.42%), Assyrian/Chaldean/Syriac (6.5%, a difference of 0.43%), and Bulgarian (6.5%, a difference of 0.62%).
| Demographics | Rating | Rank | Unemployment Among Women with Children Under 6 years |
| Immigrants | Bulgaria | 100.0 /100 | #14 | Exceptional 6.3% |
| Thais | 100.0 /100 | #15 | Exceptional 6.3% |
| Immigrants | Uzbekistan | 100.0 /100 | #16 | Exceptional 6.3% |
| Immigrants | Malaysia | 100.0 /100 | #17 | Exceptional 6.4% |
| Assyrians/Chaldeans/Syriacs | 100.0 /100 | #18 | Exceptional 6.5% |
| Mongolians | 100.0 /100 | #19 | Exceptional 6.5% |
| Ute | 100.0 /100 | #20 | Exceptional 6.5% |
| Burmese | 100.0 /100 | #21 | Exceptional 6.5% |
| Immigrants | Korea | 100.0 /100 | #22 | Exceptional 6.5% |
| Bulgarians | 100.0 /100 | #23 | Exceptional 6.5% |
| Laotians | 100.0 /100 | #24 | Exceptional 6.5% |
| Soviet Union | 100.0 /100 | #25 | Exceptional 6.5% |
| Cypriots | 100.0 /100 | #26 | Exceptional 6.5% |
| Immigrants | Japan | 100.0 /100 | #27 | Exceptional 6.5% |
| Immigrants | Israel | 100.0 /100 | #28 | Exceptional 6.5% |
Demographics Similar to Immigrants from Barbados by Unemployment Among Women with Children Under 6 years
In terms of unemployment among women with children under 6 years, the demographic groups most similar to Immigrants from Barbados are Comanche (8.0%, a difference of 0.020%), Kiowa (8.0%, a difference of 0.050%), Immigrants from Costa Rica (8.0%, a difference of 0.060%), Immigrants from Trinidad and Tobago (8.0%, a difference of 0.20%), and Welsh (8.0%, a difference of 0.29%).
| Demographics | Rating | Rank | Unemployment Among Women with Children Under 6 years |
| Salvadorans | 5.5 /100 | #229 | Tragic 8.0% |
| Finns | 5.3 /100 | #230 | Tragic 8.0% |
| Trinidadians and Tobagonians | 5.3 /100 | #231 | Tragic 8.0% |
| Welsh | 5.0 /100 | #232 | Tragic 8.0% |
| Immigrants | Trinidad and Tobago | 4.8 /100 | #233 | Tragic 8.0% |
| Kiowa | 4.4 /100 | #234 | Tragic 8.0% |
| Comanche | 4.3 /100 | #235 | Tragic 8.0% |
| Immigrants | Barbados | 4.2 /100 | #236 | Tragic 8.0% |
| Immigrants | Costa Rica | 4.1 /100 | #237 | Tragic 8.0% |
| Immigrants | Middle Africa | 3.2 /100 | #238 | Tragic 8.1% |
| Irish | 2.7 /100 | #239 | Tragic 8.1% |
| Immigrants | El Salvador | 2.6 /100 | #240 | Tragic 8.1% |
| Liberians | 2.6 /100 | #241 | Tragic 8.1% |
| Dutch | 2.5 /100 | #242 | Tragic 8.1% |
| Hawaiians | 1.8 /100 | #243 | Tragic 8.2% |