Immigrants from Albania vs Dutch West Indian Unemployment Among Ages 65 to 74 years
COMPARE
Immigrants from Albania
Dutch West Indian
Unemployment Among Ages 65 to 74 years
Unemployment Among Ages 65 to 74 years Comparison
Immigrants from Albania
Dutch West Indians
5.5%
UNEMPLOYMENT AMONG AGES 65 TO 74 YEARS
3.7/ 100
METRIC RATING
227th/ 347
METRIC RANK
5.5%
UNEMPLOYMENT AMONG AGES 65 TO 74 YEARS
11.5/ 100
METRIC RATING
208th/ 347
METRIC RANK
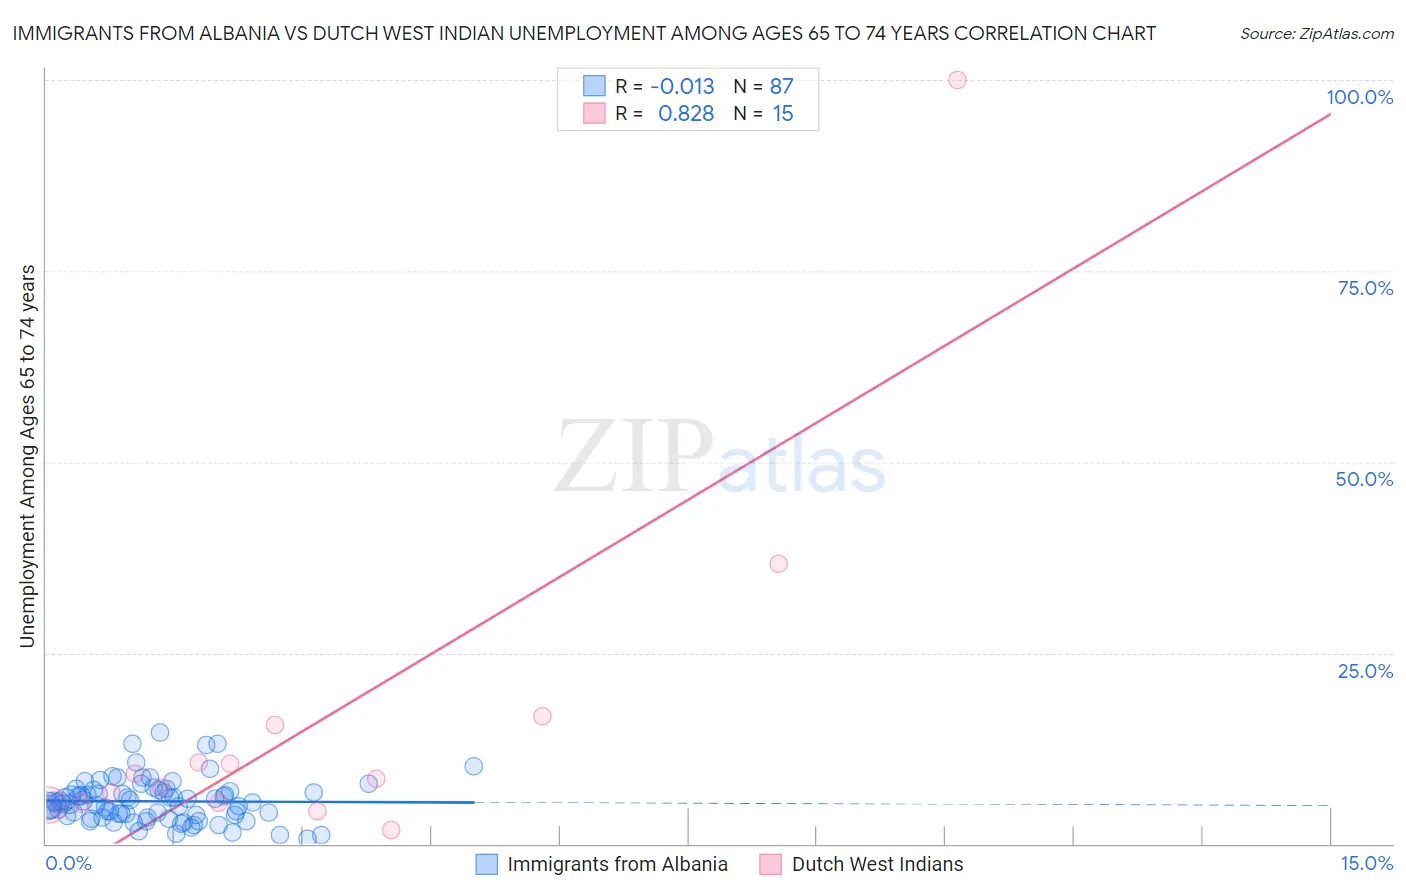
Immigrants from Albania vs Dutch West Indian Unemployment Among Ages 65 to 74 years Correlation Chart
The statistical analysis conducted on geographies consisting of 114,150,283 people shows no correlation between the proportion of Immigrants from Albania and unemployment rate among population between the ages 65 and 74 in the United States with a correlation coefficient (R) of -0.013 and weighted average of 5.5%. Similarly, the statistical analysis conducted on geographies consisting of 78,689,705 people shows a very strong positive correlation between the proportion of Dutch West Indians and unemployment rate among population between the ages 65 and 74 in the United States with a correlation coefficient (R) of 0.828 and weighted average of 5.5%, a difference of 0.99%.
Unemployment Among Ages 65 to 74 years Correlation Summary
| Measurement | Immigrants from Albania | Dutch West Indian |
| Minimum | 0.70% | 1.8% |
| Maximum | 14.5% | 100.0% |
| Range | 13.8% | 98.2% |
| Mean | 5.6% | 16.2% |
| Median | 5.3% | 8.6% |
| Interquartile 25% (IQ1) | 3.7% | 5.4% |
| Interquartile 75% (IQ3) | 6.9% | 15.5% |
| Interquartile Range (IQR) | 3.2% | 10.2% |
| Standard Deviation (Sample) | 2.8% | 24.6% |
| Standard Deviation (Population) | 2.8% | 23.8% |
Demographics Similar to Immigrants from Albania and Dutch West Indians by Unemployment Among Ages 65 to 74 years
In terms of unemployment among ages 65 to 74 years, the demographic groups most similar to Immigrants from Albania are Honduran (5.5%, a difference of 0.0%), Immigrants from Trinidad and Tobago (5.5%, a difference of 0.090%), Immigrants from Uruguay (5.5%, a difference of 0.10%), Hungarian (5.5%, a difference of 0.15%), and Apache (5.5%, a difference of 0.16%). Similarly, the demographic groups most similar to Dutch West Indians are Immigrants from Uzbekistan (5.5%, a difference of 0.080%), Immigrants from Honduras (5.5%, a difference of 0.090%), Immigrants from Northern Africa (5.5%, a difference of 0.12%), Immigrants from Croatia (5.5%, a difference of 0.22%), and Haitian (5.5%, a difference of 0.36%).
| Demographics | Rating | Rank | Unemployment Among Ages 65 to 74 years |
| Immigrants | Uzbekistan | 12.5 /100 | #207 | Poor 5.5% |
| Dutch West Indians | 11.5 /100 | #208 | Poor 5.5% |
| Immigrants | Honduras | 10.4 /100 | #209 | Poor 5.5% |
| Immigrants | Northern Africa | 10.1 /100 | #210 | Poor 5.5% |
| Immigrants | Croatia | 9.1 /100 | #211 | Tragic 5.5% |
| Haitians | 7.7 /100 | #212 | Tragic 5.5% |
| Italians | 7.7 /100 | #213 | Tragic 5.5% |
| Egyptians | 7.6 /100 | #214 | Tragic 5.5% |
| Americans | 7.3 /100 | #215 | Tragic 5.5% |
| Uruguayans | 6.2 /100 | #216 | Tragic 5.5% |
| Blackfeet | 5.8 /100 | #217 | Tragic 5.5% |
| Samoans | 5.7 /100 | #218 | Tragic 5.5% |
| Alsatians | 5.6 /100 | #219 | Tragic 5.5% |
| Immigrants | Syria | 5.1 /100 | #220 | Tragic 5.5% |
| Spaniards | 4.8 /100 | #221 | Tragic 5.5% |
| Apache | 4.5 /100 | #222 | Tragic 5.5% |
| Hungarians | 4.4 /100 | #223 | Tragic 5.5% |
| Immigrants | Uruguay | 4.2 /100 | #224 | Tragic 5.5% |
| Immigrants | Trinidad and Tobago | 4.1 /100 | #225 | Tragic 5.5% |
| Hondurans | 3.7 /100 | #226 | Tragic 5.5% |
| Immigrants | Albania | 3.7 /100 | #227 | Tragic 5.5% |