Greek vs Immigrants from Kenya Unemployment Among Seniors over 75 years
COMPARE
Greek
Immigrants from Kenya
Unemployment Among Seniors over 75 years
Unemployment Among Seniors over 75 years Comparison
Greeks
Immigrants from Kenya
9.4%
UNEMPLOYMENT AMONG SENIORS OVER 75 YEARS
0.4/ 100
METRIC RATING
268th/ 347
METRIC RANK
8.8%
UNEMPLOYMENT AMONG SENIORS OVER 75 YEARS
31.8/ 100
METRIC RATING
192nd/ 347
METRIC RANK
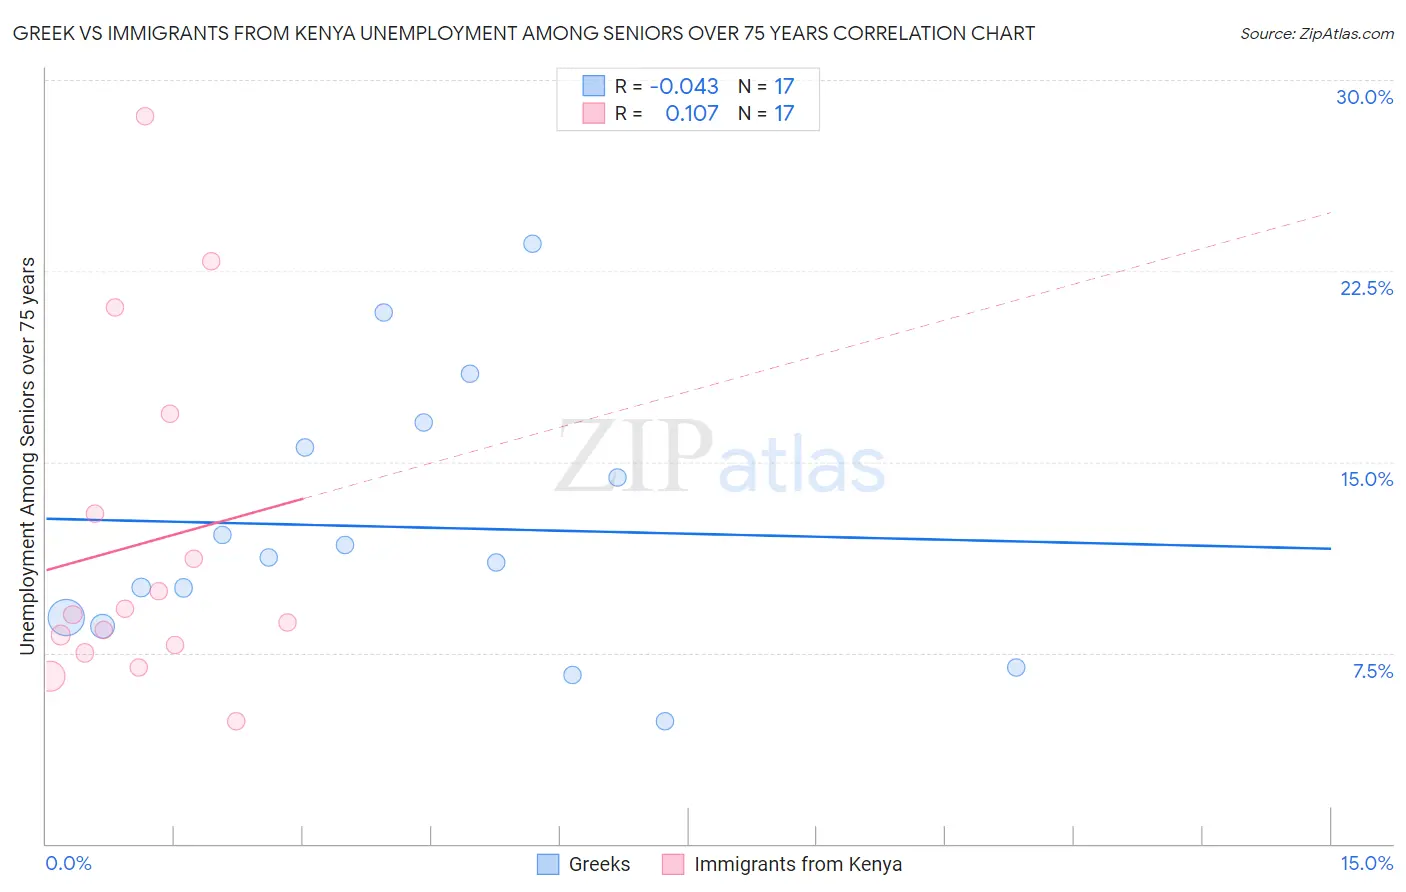
Greek vs Immigrants from Kenya Unemployment Among Seniors over 75 years Correlation Chart
The statistical analysis conducted on geographies consisting of 222,895,575 people shows no correlation between the proportion of Greeks and unemployment rate among seniors over the age of 75 in the United States with a correlation coefficient (R) of -0.043 and weighted average of 9.4%. Similarly, the statistical analysis conducted on geographies consisting of 135,447,825 people shows a poor positive correlation between the proportion of Immigrants from Kenya and unemployment rate among seniors over the age of 75 in the United States with a correlation coefficient (R) of 0.107 and weighted average of 8.8%, a difference of 6.4%.
Unemployment Among Seniors over 75 years Correlation Summary
| Measurement | Greek | Immigrants from Kenya |
| Minimum | 4.8% | 4.8% |
| Maximum | 23.6% | 28.6% |
| Range | 18.7% | 23.8% |
| Mean | 12.4% | 11.8% |
| Median | 11.3% | 9.0% |
| Interquartile 25% (IQ1) | 8.7% | 7.6% |
| Interquartile 75% (IQ3) | 16.1% | 14.9% |
| Interquartile Range (IQR) | 7.3% | 7.3% |
| Standard Deviation (Sample) | 5.2% | 6.6% |
| Standard Deviation (Population) | 5.0% | 6.4% |
Similar Demographics by Unemployment Among Seniors over 75 years
Demographics Similar to Greeks by Unemployment Among Seniors over 75 years
In terms of unemployment among seniors over 75 years, the demographic groups most similar to Greeks are Puerto Rican (9.4%, a difference of 0.14%), Immigrants from Mexico (9.4%, a difference of 0.16%), Yaqui (9.4%, a difference of 0.23%), Black/African American (9.4%, a difference of 0.28%), and Bulgarian (9.4%, a difference of 0.31%).
| Demographics | Rating | Rank | Unemployment Among Seniors over 75 years |
| Celtics | 0.8 /100 | #261 | Tragic 9.3% |
| Austrians | 0.7 /100 | #262 | Tragic 9.3% |
| Ukrainians | 0.7 /100 | #263 | Tragic 9.3% |
| Iroquois | 0.7 /100 | #264 | Tragic 9.3% |
| Palestinians | 0.6 /100 | #265 | Tragic 9.3% |
| Blacks/African Americans | 0.5 /100 | #266 | Tragic 9.4% |
| Immigrants | Mexico | 0.4 /100 | #267 | Tragic 9.4% |
| Greeks | 0.4 /100 | #268 | Tragic 9.4% |
| Puerto Ricans | 0.3 /100 | #269 | Tragic 9.4% |
| Yaqui | 0.3 /100 | #270 | Tragic 9.4% |
| Bulgarians | 0.3 /100 | #271 | Tragic 9.4% |
| Immigrants | Iraq | 0.3 /100 | #272 | Tragic 9.4% |
| Czechoslovakians | 0.3 /100 | #273 | Tragic 9.4% |
| Jamaicans | 0.2 /100 | #274 | Tragic 9.5% |
| Senegalese | 0.2 /100 | #275 | Tragic 9.5% |
Demographics Similar to Immigrants from Kenya by Unemployment Among Seniors over 75 years
In terms of unemployment among seniors over 75 years, the demographic groups most similar to Immigrants from Kenya are Estonian (8.8%, a difference of 0.090%), Immigrants from Guyana (8.8%, a difference of 0.12%), Mexican American Indian (8.8%, a difference of 0.17%), Maltese (8.8%, a difference of 0.17%), and Immigrants from Eastern Europe (8.8%, a difference of 0.18%).
| Demographics | Rating | Rank | Unemployment Among Seniors over 75 years |
| Choctaw | 37.1 /100 | #185 | Fair 8.8% |
| Immigrants | Ethiopia | 36.2 /100 | #186 | Fair 8.8% |
| Immigrants | Europe | 35.2 /100 | #187 | Fair 8.8% |
| Immigrants | Eastern Europe | 34.7 /100 | #188 | Fair 8.8% |
| Immigrants | Haiti | 34.7 /100 | #189 | Fair 8.8% |
| Mexican American Indians | 34.7 /100 | #190 | Fair 8.8% |
| Estonians | 33.3 /100 | #191 | Fair 8.8% |
| Immigrants | Kenya | 31.8 /100 | #192 | Fair 8.8% |
| Immigrants | Guyana | 29.9 /100 | #193 | Fair 8.8% |
| Maltese | 29.2 /100 | #194 | Fair 8.8% |
| Okinawans | 28.9 /100 | #195 | Fair 8.8% |
| Immigrants | Jamaica | 27.7 /100 | #196 | Fair 8.9% |
| Immigrants | Laos | 26.3 /100 | #197 | Fair 8.9% |
| Eastern Europeans | 25.9 /100 | #198 | Fair 8.9% |
| Pakistanis | 25.4 /100 | #199 | Fair 8.9% |