French American Indian vs Immigrants from Kenya Unemployment Among Seniors over 75 years
COMPARE
French American Indian
Immigrants from Kenya
Unemployment Among Seniors over 75 years
Unemployment Among Seniors over 75 years Comparison
French American Indians
Immigrants from Kenya
8.2%
UNEMPLOYMENT AMONG SENIORS OVER 75 YEARS
98.7/ 100
METRIC RATING
111th/ 347
METRIC RANK
8.8%
UNEMPLOYMENT AMONG SENIORS OVER 75 YEARS
31.8/ 100
METRIC RATING
192nd/ 347
METRIC RANK
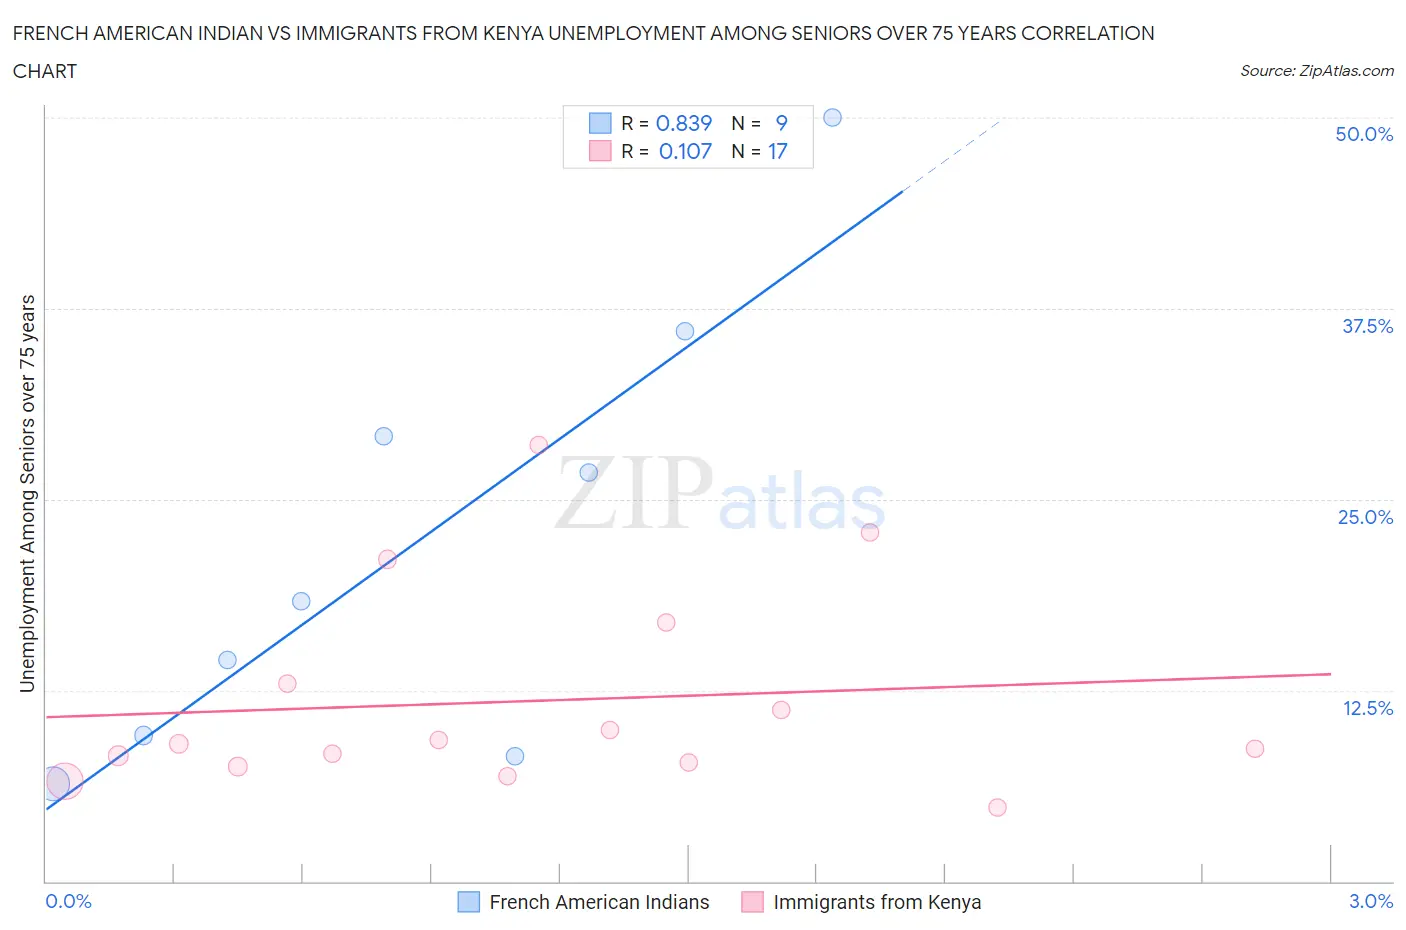
French American Indian vs Immigrants from Kenya Unemployment Among Seniors over 75 years Correlation Chart
The statistical analysis conducted on geographies consisting of 91,479,852 people shows a very strong positive correlation between the proportion of French American Indians and unemployment rate among seniors over the age of 75 in the United States with a correlation coefficient (R) of 0.839 and weighted average of 8.2%. Similarly, the statistical analysis conducted on geographies consisting of 135,447,825 people shows a poor positive correlation between the proportion of Immigrants from Kenya and unemployment rate among seniors over the age of 75 in the United States with a correlation coefficient (R) of 0.107 and weighted average of 8.8%, a difference of 7.2%.
Unemployment Among Seniors over 75 years Correlation Summary
| Measurement | French American Indian | Immigrants from Kenya |
| Minimum | 6.4% | 4.8% |
| Maximum | 50.0% | 28.6% |
| Range | 43.6% | 23.8% |
| Mean | 22.1% | 11.8% |
| Median | 18.3% | 9.0% |
| Interquartile 25% (IQ1) | 8.8% | 7.6% |
| Interquartile 75% (IQ3) | 32.6% | 14.9% |
| Interquartile Range (IQR) | 23.8% | 7.3% |
| Standard Deviation (Sample) | 14.6% | 6.6% |
| Standard Deviation (Population) | 13.8% | 6.4% |
Similar Demographics by Unemployment Among Seniors over 75 years
Demographics Similar to French American Indians by Unemployment Among Seniors over 75 years
In terms of unemployment among seniors over 75 years, the demographic groups most similar to French American Indians are Marshallese (8.2%, a difference of 0.050%), Immigrants from Lebanon (8.2%, a difference of 0.070%), Laotian (8.2%, a difference of 0.10%), Immigrants from India (8.2%, a difference of 0.13%), and Asian (8.3%, a difference of 0.18%).
| Demographics | Rating | Rank | Unemployment Among Seniors over 75 years |
| Immigrants | South Central Asia | 99.0 /100 | #104 | Exceptional 8.2% |
| Immigrants | Caribbean | 99.0 /100 | #105 | Exceptional 8.2% |
| Immigrants | Honduras | 99.0 /100 | #106 | Exceptional 8.2% |
| Sri Lankans | 98.9 /100 | #107 | Exceptional 8.2% |
| Laotians | 98.8 /100 | #108 | Exceptional 8.2% |
| Immigrants | Lebanon | 98.8 /100 | #109 | Exceptional 8.2% |
| Marshallese | 98.7 /100 | #110 | Exceptional 8.2% |
| French American Indians | 98.7 /100 | #111 | Exceptional 8.2% |
| Immigrants | India | 98.6 /100 | #112 | Exceptional 8.2% |
| Asians | 98.5 /100 | #113 | Exceptional 8.3% |
| Trinidadians and Tobagonians | 98.4 /100 | #114 | Exceptional 8.3% |
| Sudanese | 98.2 /100 | #115 | Exceptional 8.3% |
| Immigrants | West Indies | 98.1 /100 | #116 | Exceptional 8.3% |
| Immigrants | Greece | 97.9 /100 | #117 | Exceptional 8.3% |
| Immigrants | Middle Africa | 97.9 /100 | #118 | Exceptional 8.3% |
Demographics Similar to Immigrants from Kenya by Unemployment Among Seniors over 75 years
In terms of unemployment among seniors over 75 years, the demographic groups most similar to Immigrants from Kenya are Estonian (8.8%, a difference of 0.090%), Immigrants from Guyana (8.8%, a difference of 0.12%), Mexican American Indian (8.8%, a difference of 0.17%), Maltese (8.8%, a difference of 0.17%), and Immigrants from Eastern Europe (8.8%, a difference of 0.18%).
| Demographics | Rating | Rank | Unemployment Among Seniors over 75 years |
| Choctaw | 37.1 /100 | #185 | Fair 8.8% |
| Immigrants | Ethiopia | 36.2 /100 | #186 | Fair 8.8% |
| Immigrants | Europe | 35.2 /100 | #187 | Fair 8.8% |
| Immigrants | Eastern Europe | 34.7 /100 | #188 | Fair 8.8% |
| Immigrants | Haiti | 34.7 /100 | #189 | Fair 8.8% |
| Mexican American Indians | 34.7 /100 | #190 | Fair 8.8% |
| Estonians | 33.3 /100 | #191 | Fair 8.8% |
| Immigrants | Kenya | 31.8 /100 | #192 | Fair 8.8% |
| Immigrants | Guyana | 29.9 /100 | #193 | Fair 8.8% |
| Maltese | 29.2 /100 | #194 | Fair 8.8% |
| Okinawans | 28.9 /100 | #195 | Fair 8.8% |
| Immigrants | Jamaica | 27.7 /100 | #196 | Fair 8.9% |
| Immigrants | Laos | 26.3 /100 | #197 | Fair 8.9% |
| Eastern Europeans | 25.9 /100 | #198 | Fair 8.9% |
| Pakistanis | 25.4 /100 | #199 | Fair 8.9% |