Immigrants from Sudan vs Dutch Unemployment Among Women with Children Under 6 years
COMPARE
Immigrants from Sudan
Dutch
Unemployment Among Women with Children Under 6 years
Unemployment Among Women with Children Under 6 years Comparison
Immigrants from Sudan
Dutch
8.0%
UNEMPLOYMENT AMONG WOMEN WITH CHILDREN UNDER 6 YEARS
6.0/ 100
METRIC RATING
228th/ 347
METRIC RANK
8.1%
UNEMPLOYMENT AMONG WOMEN WITH CHILDREN UNDER 6 YEARS
2.5/ 100
METRIC RATING
242nd/ 347
METRIC RANK
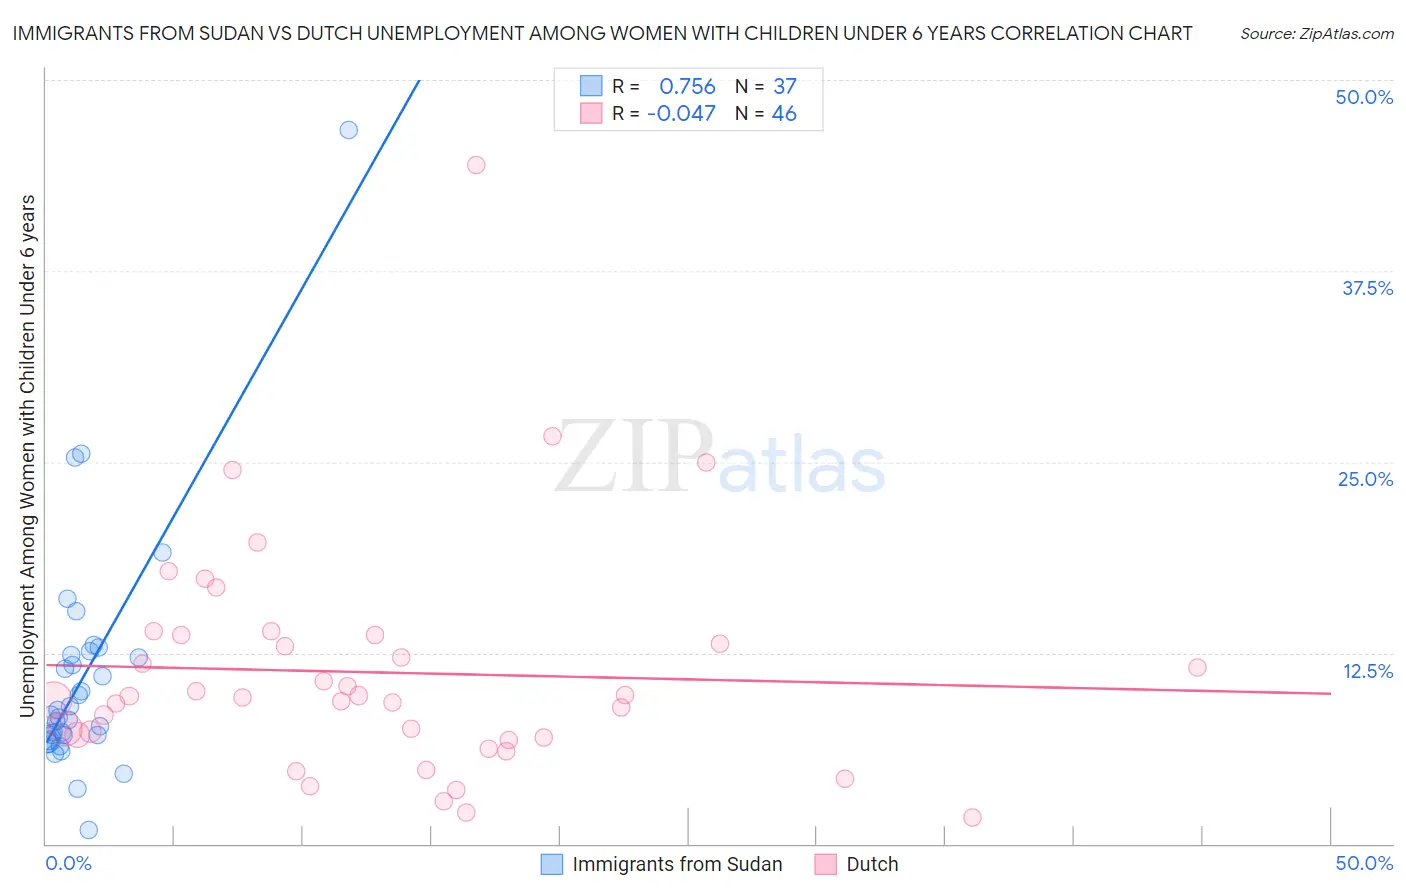
Immigrants from Sudan vs Dutch Unemployment Among Women with Children Under 6 years Correlation Chart
The statistical analysis conducted on geographies consisting of 108,811,214 people shows a strong positive correlation between the proportion of Immigrants from Sudan and unemployment rate among women with children under the age of 6 in the United States with a correlation coefficient (R) of 0.756 and weighted average of 8.0%. Similarly, the statistical analysis conducted on geographies consisting of 369,089,937 people shows no correlation between the proportion of Dutch and unemployment rate among women with children under the age of 6 in the United States with a correlation coefficient (R) of -0.047 and weighted average of 8.1%, a difference of 1.5%.
Unemployment Among Women with Children Under 6 years Correlation Summary
| Measurement | Immigrants from Sudan | Dutch |
| Minimum | 0.90% | 1.7% |
| Maximum | 46.7% | 44.4% |
| Range | 45.8% | 42.7% |
| Mean | 11.0% | 11.2% |
| Median | 8.4% | 9.6% |
| Interquartile 25% (IQ1) | 7.0% | 7.0% |
| Interquartile 75% (IQ3) | 12.5% | 13.7% |
| Interquartile Range (IQR) | 5.5% | 6.7% |
| Standard Deviation (Sample) | 7.9% | 7.6% |
| Standard Deviation (Population) | 7.8% | 7.5% |
Demographics Similar to Immigrants from Sudan and Dutch by Unemployment Among Women with Children Under 6 years
In terms of unemployment among women with children under 6 years, the demographic groups most similar to Immigrants from Sudan are Portuguese (8.0%, a difference of 0.030%), Senegalese (8.0%, a difference of 0.040%), Salvadoran (8.0%, a difference of 0.15%), Finnish (8.0%, a difference of 0.22%), and Trinidadian and Tobagonian (8.0%, a difference of 0.22%). Similarly, the demographic groups most similar to Dutch are Liberian (8.1%, a difference of 0.060%), Immigrants from El Salvador (8.1%, a difference of 0.080%), Irish (8.1%, a difference of 0.16%), Immigrants from Middle Africa (8.1%, a difference of 0.42%), and Hawaiian (8.2%, a difference of 0.56%).
| Demographics | Rating | Rank | Unemployment Among Women with Children Under 6 years |
| Germans | 7.0 /100 | #225 | Tragic 8.0% |
| Senegalese | 6.2 /100 | #226 | Tragic 8.0% |
| Portuguese | 6.2 /100 | #227 | Tragic 8.0% |
| Immigrants | Sudan | 6.0 /100 | #228 | Tragic 8.0% |
| Salvadorans | 5.5 /100 | #229 | Tragic 8.0% |
| Finns | 5.3 /100 | #230 | Tragic 8.0% |
| Trinidadians and Tobagonians | 5.3 /100 | #231 | Tragic 8.0% |
| Welsh | 5.0 /100 | #232 | Tragic 8.0% |
| Immigrants | Trinidad and Tobago | 4.8 /100 | #233 | Tragic 8.0% |
| Kiowa | 4.4 /100 | #234 | Tragic 8.0% |
| Comanche | 4.3 /100 | #235 | Tragic 8.0% |
| Immigrants | Barbados | 4.2 /100 | #236 | Tragic 8.0% |
| Immigrants | Costa Rica | 4.1 /100 | #237 | Tragic 8.0% |
| Immigrants | Middle Africa | 3.2 /100 | #238 | Tragic 8.1% |
| Irish | 2.7 /100 | #239 | Tragic 8.1% |
| Immigrants | El Salvador | 2.6 /100 | #240 | Tragic 8.1% |
| Liberians | 2.6 /100 | #241 | Tragic 8.1% |
| Dutch | 2.5 /100 | #242 | Tragic 8.1% |
| Hawaiians | 1.8 /100 | #243 | Tragic 8.2% |
| French | 1.7 /100 | #244 | Tragic 8.2% |
| Native Hawaiians | 1.7 /100 | #245 | Tragic 8.2% |